Unlocking the Power of Pure Copper with EOS M290 1kW system

In the evolving world of Additive Manufacturing (AM), precision, performance, and material integrity are critical. One of the most transformative developments in this field is the ability to 3D print pure copper and copper alloys with high electrical and thermal conductivity — materials once considered extremely challenging due to their reflectivity and thermal behavior.

Thanks to the advancements in EOS metal 3D printing systems, particularly the EOS M 290 with 1kW laser configuration developed by AMCM (an EOS Group company), manufacturing complex, high-performance copper parts is now a reality.


Why Print with Pure Copper?

Pure copper is renowned for its exceptional conductivity, but its high reflectivity and thermal conductivity pose significant hurdles in laser-based 3D printing. EOS has overcome this with tailored process parameters and specialized hardware:

Copper and its alloys are vital for applications such as:

  • Heat exchangers
  • Electrical connectors and windings
  • Rocket engine components
  • Induction coils
  • Marine impellers

Traditionally, producing complex geometries in these materials was time-consuming, wasteful, and restrictive. With Direct Metal Laser Solidification (DMLS), EOS enables geometrical freedom, material efficiency, and functional performance — redefining how copper is used in manufacturing.


EOS Copper Portfolio at a Glance

EOS Copper Cu (Pure Copper for EOS M 290 – 400W Laser)

  • Conductivity: >90% IACS (heat-treated)
  • Mechanical Strength: 180 MPa yield, 200 MPa tensile
  • Layer Thickness: 20 µm
  • Use Case: Early adoption and R&D for heat exchangers, electronics

A solid choice for foundational pure copper applications where moderate build rates and high conductivity are essential.
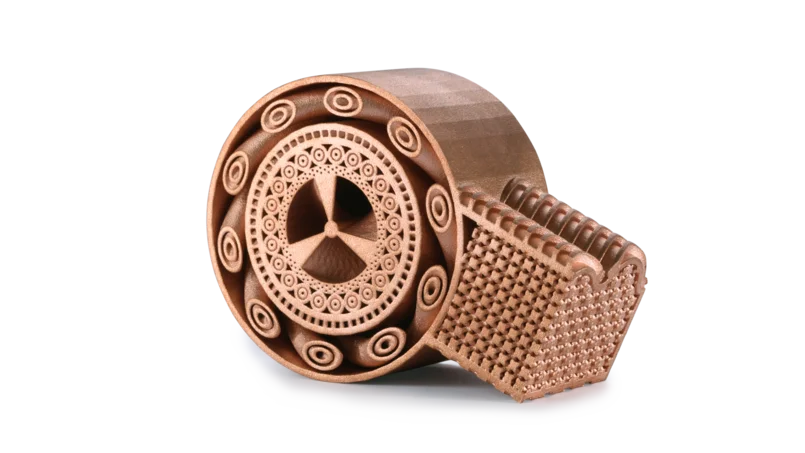
 

EOS Copper CuCP (Commercially Pure Copper for AMCM M 290 – 1kW Laser)

  • Purity: >99.95%
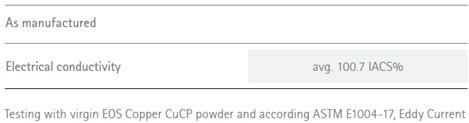
  • Conductivity: Up to 102.6% IACS (heat-treated)
  • Elongation at Break: Up to 55%
  • Layer Thickness: 40 µm
  • Volume Rate: 5.4 mm³/s
  • TRL: 5
  • Use Case: Inductors, high-current connectors, electric motors

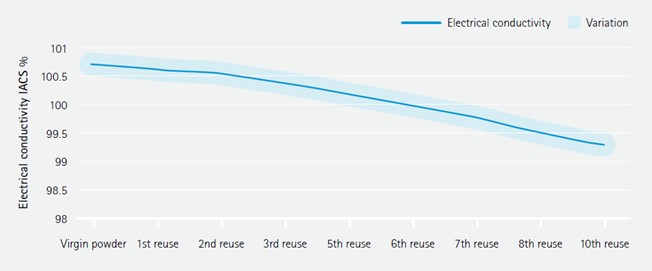
With dual exposure strategies (bulk and application-specific), CuCP balances conductivity, productivity, and repeatability — even across multiple powder reuses.
EOS CopperAlloy CuCrZr (Strength + Conductivity for AMCM M 290 – 1kW Laser)

  • Yield Strength (HT): 210 MPa
  • Tensile Strength (HT): 340 MPa
  • Conductivity (HT): >80% IACS
  • Volume Rate: 15.4 mm³/s
  • Layer Thickness: 80 µm
  • Use Case: Rocket nozzles, high-stress coils, heat sinks

An ideal choice for components requiring durability under heat and pressure — bridging structural integrity with electrical function.
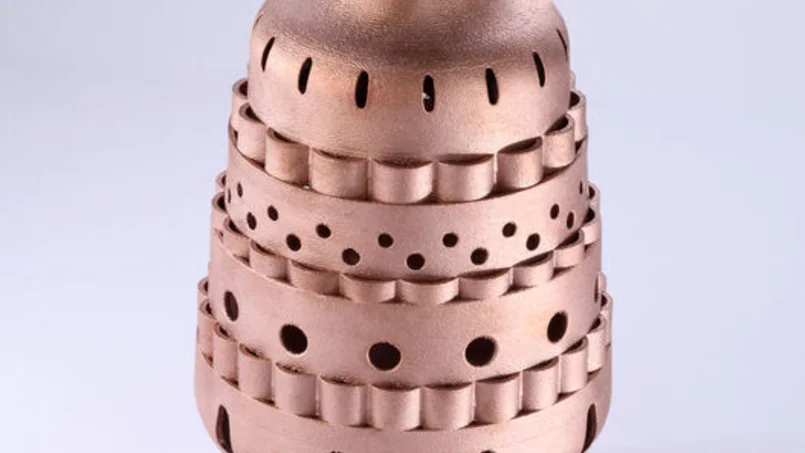


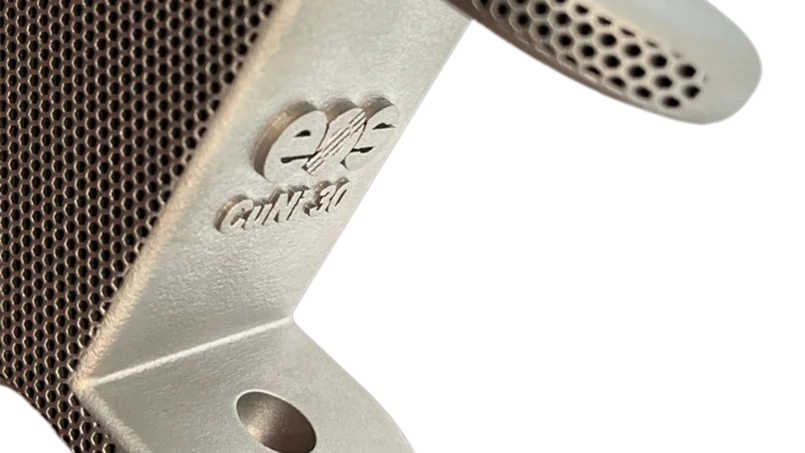
EOS Copper Alloy CuNi30 (Saltwater-Resistant Alloy for EOS M 290 & M 400-1)

  • Excellent corrosion resistance in salt water
  • Yield Strength (HT): Up to 560 MPa
  • Tensile Strength (HT): Up to 700 MPa
  • Layer Thickness: 60 µm
  • Volume Rate: 5.2 mm³/s
  • Use Case: Marine parts, impellers, offshore pump housings

CuNi30 offers marine-grade protection and strength — performing reliably even in low temperatures and aggressive environments.


Built on the EOS Quality Triangle

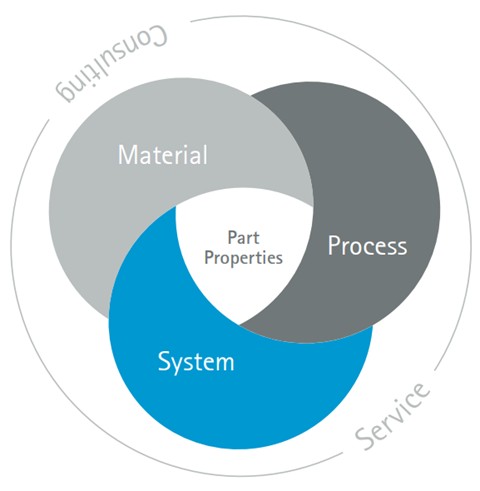
Every material developed by EOS aligns with its Quality Triangle: System, Material, and Process. This ensures consistent, repeatable results — whether you’re building a powertrain coil, a marine pump, or a next-gen electric drive.

From TRL 3 exploratory materials to TRL 7+ validated products, EOS supports the entire adoption curve — from research to production.

Real Impact, Real Innovation

EOS metal systems make what was once impossible, now industrially viable:

  • High conductivity copper parts printed directly, with minimal post-processing
  • Optimized exposure strategies for delicate features like windings and thin walls
  • Heat treatments tailored for specific mechanical and thermal outcomes
  • Minimized defects, even after multiple powder reuses

The convergence of material science, laser power, and process know-how empowers designers and engineers to innovate without constraint.


EOS Metal Systems: Tailored for Copper Printing

EOS doesn’t just supply powders — it delivers a complete solution. Their Quality Triangle approach integrates system, material, and process, ensuring consistent output across industries. EOS M 290 configurations (standard and 1kW variants) deliver:

  • Closed-loop thermal monitoring
  • Precision recoating mechanisms
  • Software-controlled exposure profiles
  • Compatibility with argon-protected atmospheres for material purity

Final Thoughts: Applications Driving Demand

Industries such as aerospace, automotive, energy, and electronics are increasingly adopting copper AM parts for:

  • Weight-optimized heat sinks and exchangers
  • Compact, complex geometries in RF and inductive components
  • Conformal cooling and embedded circuitry in power systems

By enabling the additive manufacture of high-conductivity copper and alloy parts, EOS empowers engineers to design for function without compromise — ushering in a new era of metal AM performance.
3D MIDs with Aerosol Jet Technology by Optomec

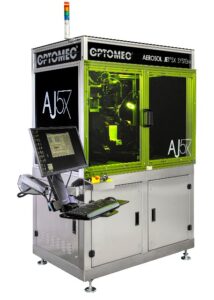
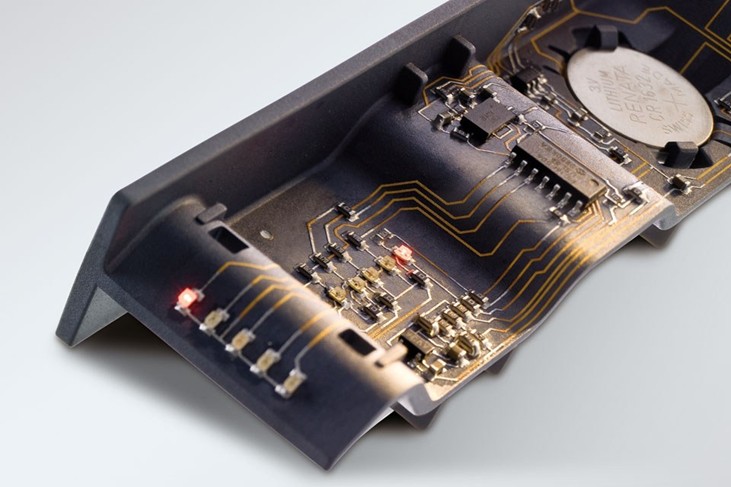
In the rapidly evolving landscape of electronics manufacturing, the demand for compact, lightweight, and multifunctional components is higher than ever. One such innovation answering this call is the 3D Molded Interconnect Device (3D MID) — a technology that seamlessly integrates mechanical and electronic functions into a single, three-dimensional component. And at the forefront of enabling this revolution is Optomec’s Aerosol Jet® technology, a game-changer in the world of additive manufacturing.


What is 3D MID?

3D MIDs combine plastic parts with integrated electronic circuitry, replacing traditional PCB assemblies. Instead of mounting a PCB into a moulded housing, the circuitry is directly printed onto the housing itself. This eliminates the need for connectors, cables, and additional assemblies—resulting in lighter, smaller, and more reliable products.

Common applications include:

  • Automotive sensor housings
  • Wearable devices
  • Medical instruments
  • Consumer electronics
  • Industrial controls


Enter Optomec Aerosol Jet Technology

Optomec’s Aerosol Jet® technology enables the precise, non-contact deposition of electronic inks onto virtually any 3D surface. Unlike screen printing or inkjet methods that are limited to 2D substrates, Aerosol Jet is capable of printing ultra-fine features (as small as 10 microns) on complex geometries, including curved or contoured surfaces commonly found in 3D MID designs.

Key Advantages:

  • True 3D Conformal Printing: Ideal for printing on non-planar surfaces like injection-moulded plastics.
  • High Resolution: Circuit features as fine as 10 µm can be printed without masks or screens.
  • Material Flexibility: Compatible with a wide range of conductive inks (silver, copper, carbon) and dielectric materials.
  • Scalable and Repeatable: Production-ready for low to mid-volume manufacturing with excellent repeatability.


How it Works

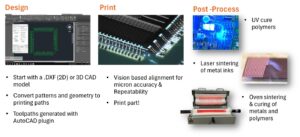
  1. Ink Atomization: Liquid ink is transformed into an aerosol mist using ultrasonic or pneumatic methods.
  2. Aerosol Transport: The mist is carried by a carrier gas to the deposition head.
  3. Focused Deposition: A sheath gas surrounds the mist to focus the stream to a precise spot, enabling high-resolution printing on 3D surfaces.
  4. Post-Processing: After deposition, thermal or photonic curing is used to solidify the ink.

This process eliminates the need for traditional subtractive steps like etching or mechanical drilling, reducing material waste and speeding up production.


Industrial Impact: A New Era of Smart Products

The combination of 3D MID design and Aerosol Jet printing opens doors to a new class of smart, miniaturized products. For example:

  • In automotive: Integration of sensors and antennas directly into the car’s interior plastic panels reduces wiring and improves aesthetics.
  • In medical: Compact diagnostic devices with embedded electronics reduce the form factor without compromising functionality.
  • In wearables: Flexible, ergonomic designs can now feature embedded connectivity without the need for bulky circuit boards.


Sustainability & Cost Benefits

Aerosol Jet printing contributes to greener manufacturing by:

  • Minimizing material consumption
  • Reducing energy usage through digital processing
  • Lowering production costs with fewer process steps and less waste

It also supports design freedom, enabling rapid prototyping and agile iterations without tooling changes.


Conclusion

As devices continue to shrink and demand more functionality in less space, the synergy between 3D MID design and Optomec’s Aerosol Jet technology is setting new benchmarks in electronics manufacturing. With its ability to precisely deposit functional inks onto 3D surfaces, this technology is not just evolving how electronics are made – it’s redefining what’s possible.

Optomec Aerosol Jet is not just a tool for innovation – it’s a strategic enabler for manufacturers looking to stay ahead in a hyper-competitive market.

Resource Estimation in GEOVIA Surpac Using Geostatistics

Resource estimation is the process of quantifying the amount and grade of mineral resources within a geological deposit. It forms the foundation for feasibility studies, mine design, and financial modeling. Inaccurate estimates can lead to poor investment decisions, operational inefficiencies, and regulatory challenges. Therefore, mining professionals increasingly rely on sophisticated tools like Surpac to ensure precision and transparency.


Why Choose GEOVIA Surpac?

GEOVIA Surpac is one of the most widely used geological modeling and mine planning software platforms in the world. It supports a range of functionalities including:

– Drillhole data management
– Geological interpretation
– Block modeling
– Grade estimation
– Pit design and scheduling

Its user-friendly interface, powerful 3D visualization capabilities, and integration with geostatistical tools make it ideal for both exploration geologists and mining engineers.


Integrating Geostatistics: A Game-Changer

Geostatistics is a branch of statistics that deals with spatially correlated data. In resource estimation, it allows professionals to model the spatial distribution of grades and quantify uncertainty. Techniques such as variogram modeling, kriging, and simulation are central to this approach.

Benefits of Geostatistical Estimation:
– Improved Accuracy: Kriging provides the best linear unbiased estimate (BLUE) of unknown values.
– Quantification of Uncertainty: Helps in risk assessment and classification of resources.
– Spatial Continuity: Captures geological trends and anisotropy effectively.


Workflow: Resource Estimation in Surpac Using Geostatistics

1. Data Preparation

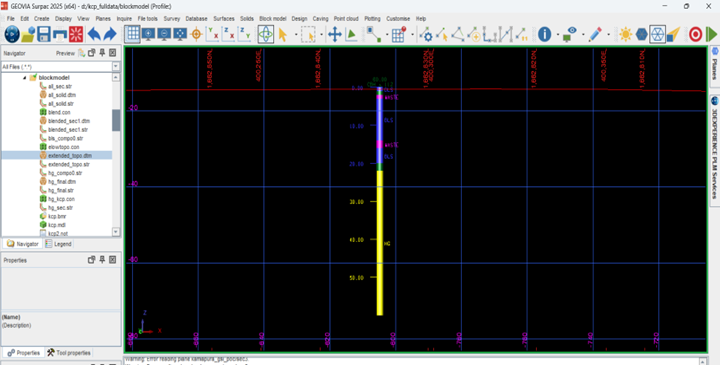
The process begins with importing and validating drillhole data. This includes assays, lithology, survey data, and coordinates. Ensuring data integrity is critical before proceeding to modeling.

2. Compositing

Samples are composited to a consistent length to reduce bias. Surpac allows flexible compositing based on lithological boundaries or fixed intervals.

3. Exploratory Data Analysis (EDA)

EDA involves statistical analysis of the data to understand distribution, detect outliers, and identify geological domains. Histograms, scatter plots, and log probability plots are commonly used.

4. Variography

Variograms are used to model spatial continuity. Surpac supports experimental variogram generation and fitting of theoretical models (e.g., spherical, exponential). Directional variograms help identify anisotropy, which is crucial for accurate estimation.

5. Block Model Construction

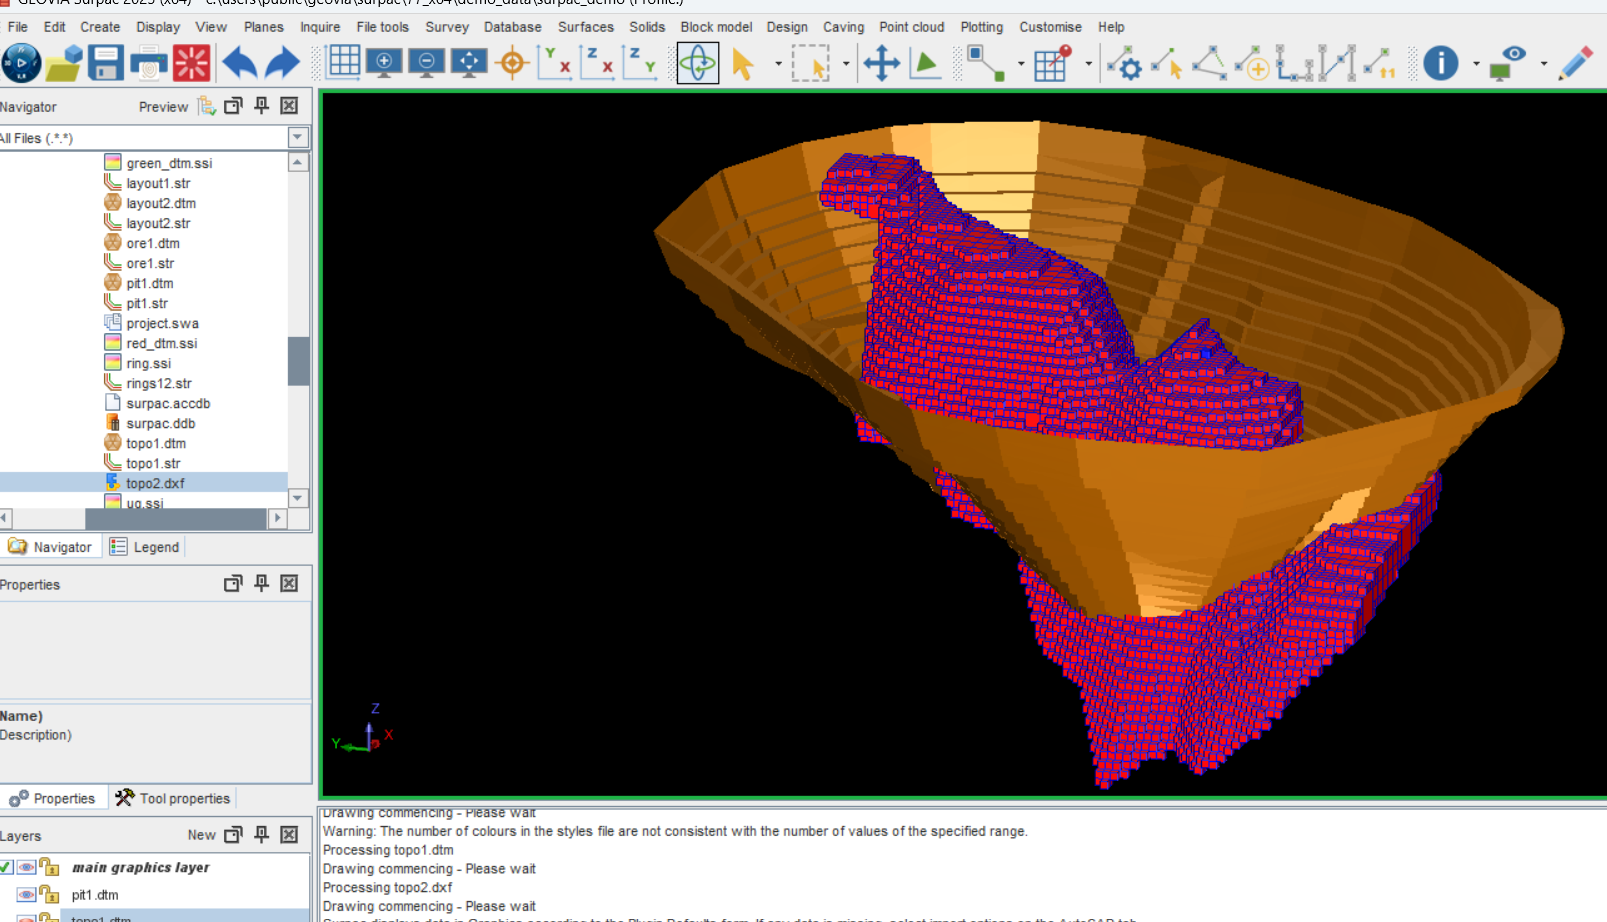
A 3D block model is created to represent the deposit. Parameters such as block size, extents, and sub-blocking are defined. Geological attributes and constraints are assigned to each block.

6. Estimation Using Kriging or ISD (Inverse Square Distance)

Kriging is the most widely used geostatistical method in Surpac. It uses the variogram model to interpolate grades into the block model. Other methods like Inverse Distance Weighting (IDW) or Co-Kriging can also be applied depending on the data and objectives.

7. Ellipsoid Search Parameters

Estimation ellipsoids define the search neighborhood for kriging. They are oriented based on geological structures and variogram directions. Surpac allows customization of ellipsoid dimensions and orientations to reflect geological anisotropy.

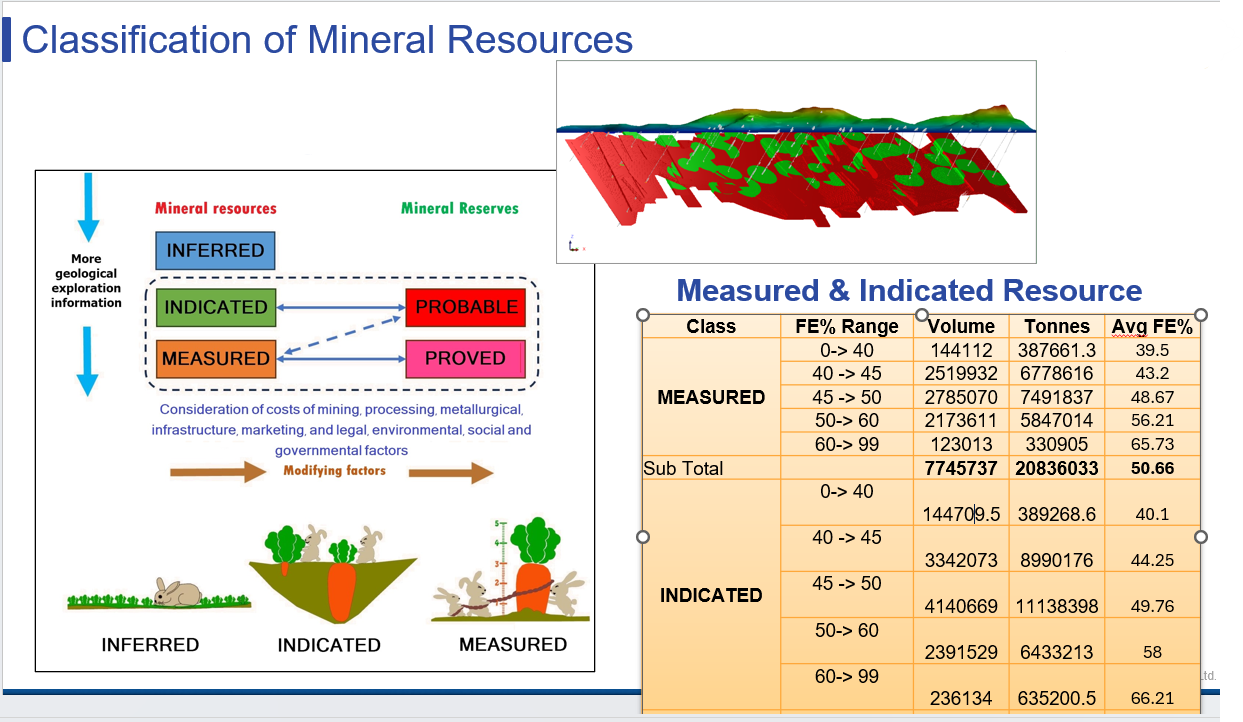
8. Validation and Classification

The model is validated using cross-validation, swath plots, and comparison with raw data. Resources are then classified into Measured, Indicated, and Inferred categories based on data density and estimation confidence.

9. Visualization and Reporting

Surpac’s 3D visualization tools enable professionals to view block models, grade shells, and estimation ellipsoids interactively. Reports can be generated for tonnage, grade, and classification summaries.


Promoting Best Practices in Resource Estimation

To maximize the benefits of Surpac and geostatistics, professionals should adhere to the following best practices:

– Use domain-specific variograms: Avoid applying a single model across geologically distinct zones.
– Validate at every step: Ensure consistency between input data, variograms, and estimation results.
– Document assumptions: Maintain transparency for audits and compliance.
– Collaborate across disciplines: Integrate geological, geotechnical, and metallurgical insights.


Conclusion: A Strategic Advantage

In today’s competitive mining landscape, the ability to produce accurate and auditable resource estimates is a strategic advantage. GEOVIA Surpac, when combined with geostatistical methods, empowers professionals to model complex deposits with confidence. From exploration to production, this integrated approach enhances decision-making, reduces risk, and supports sustainable resource development.

Whether you are a geologist, mining engineer, or resource analyst, mastering Surpac and geostatistics is an investment in precision, professionalism, and performance.

Eyes on the Horizon: Revolutionizing HUD Design with Optical Simulation

Current technology, while offering convenience, often require our continuous engagement. Traditional display systems and instrument panels necessitate that users momentarily divert their gaze and refocus, thereby disrupting their concentration. This shift in attention and alteration of the line of sight introduces considerable safety hazards. Consequently, there is a need for innovative display solutions, such as Head-Up Displays (HUDs), which can effectively incorporate critical information within the user’s primary field of view. By reducing distractions, HUDs significantly improve situational awareness and provide crucial real time data which includes speed, navigation instructions, fuel levels, warning alerts and target locations, presented on either the windshield or the combiner. This allows for faster decision making while enhancing user safety.

The prevailing challenges in developing these AR HUD devices stem from numerous design elements and mechanical interferences, which results in inconsistent image quality. The objective is to display dynamic information with wide field of view (FOV) at a virtual distance that is comfortable for the driver’s line of sight. However, packaging a large FOV optical system into the uniquely shaped and increasingly compact dashboard space of vehicles presents significant challenges. This mechanical constraint results in a sub optimal optical path, necessitating multiple iterations of the CAD design, which prolongs the design phase. Due to windshield curvature and variations, prototypes usually exhibit ghosting or double images, non-uniform colour and image distortion. It is imperative to ensure the HUD is legible and has good contrast under all lighting conditions (ambient light and glare caused by internal reflections).
The solution is to implement a virtual first approach, which can be achieved by leveraging the advanced capabilities of CODE V for optical design and optimization, and LightTools for non-sequential illumination and stray light analysis.


CODE V Capabilities: Optical Design, Packaging and Tolerancing

It is possible to export/import CAD files and use it for both visualization and/or ray tracing in sequential or non-sequential models. It allows engineers to spot clearance issues directly in CODE V, eliminating the need to switch to mechanical design software to see packaging issue.

In terms of optical performance and image quality CODE V offers numerous benefits:

  • Design Optimization: Global and local optimization features enable engineers to simultaneously optimize large eye box, virtual image distance and distortions while considering packaging constraints.
  • Image quality: aberration analysis and ghost image analysis help predict the anomalies caused by the windshield’s complex geometry and coatings. It allows precise tailoring of internal optics to minimize distortions, eliminate double reflections and ensure superior image quality and uniformity.
  • High production variability: CODE V can simulate the impact of manufacturing variations of the HUD system with its comprehensive tolerancing tool. This allows engineers to predict production yields and modify designs, if necessary, in the early stages thus significantly reducing costs.


LightTools Capabilities: Illumination, Stray Light Analysis and Visualization

Employing the non-sequential ray tracing, advance scattering models and virtual prototyping capabilities of LightTools, it is possible to simulate light interactions with every surface including dashboard, trim and windshield coatings. Detailed photometric and radiometric analysis helps achieve uniform brightness and colour distribution of the projected image, essential for driver comfort and information clarity.

LightTools has various utilities to help analyze the HUD system:

  • Image Processor: a true colour or greyscale image can be used for spatial apodization of a source (PGU). This recreates the true colour image after ray tracing through the optical system. It generates the perceived HUD image which allows for objective assessment.

  • Solar Source: Used for the sun effect analysis, it is possible to simulate sun glare under various environmental conditions by varying the angles and locations. This helps to identify and ensure good contrast and readability under all lighting conditions.
  • Parameter Analyzer: allows visualization of HUD image motion as driver moves within the eyebox.


The process of developing HUDs can be enhanced through the utilization of CODE V and LightTools, which facilitates the delivery of products that exhibit superior performance. This approach not only accelerates the time to market but also mitigates manufacturing risks, resulting in substantial cost savings.

RAMSIS: The Digital Human Model for Ergonomics in Vehicle Design

In today’s automotive landscape, designing a vehicle is no longer just about performance or aesthetics—it’s about people. As comfort, safety, and inclusivity become essential components of vehicle design, integrating human-centric approaches right from the conceptual phase is no longer optional.

This is where RAMSIS makes all the difference.

What is RAMSIS?

RAMSIS (Realistic Anthropometric Mathematical System for Interior Comfort Simulation) is the world’s leading digital human modelling (DHM) software, developed by Humanetics Digital Europe GmbH (former know as Human Solutions). It enables engineers and designers to simulate human interaction with vehicle interiors early in the design cycle using virtual manikins derived from real-world human body data.

From driver workspace design to posture validation and reach analysis, RAMSIS ensures that products are ergonomically optimized, safe, and ready to meet international regulations before any physical prototype is built.

Why Ergonomics Matters in Vehicle Design

Every interaction—be it steering, entering and exiting, adjusting a seat, or reaching a control—affects user comfort and safety. Poor ergonomics can lead to fatigue, discomfort, or even safety hazards.

With RAMSIS, vehicle manufacturers can account for variations in body size, gender, age, and regional population characteristics, ensuring the design suits real human needs. This is especially important today, as vehicles become more diverse in form—electric, autonomous, off-road, or specialized.


Key Capabilities of RAMSIS

  • Vision analysis
  • Reach and accessibility validation
  • Ingress/egress simulation
  • Posture and seat comfort evaluation
  • Customizable avatars with country-specific anthropometric data

Seamless Integration and Flexibility

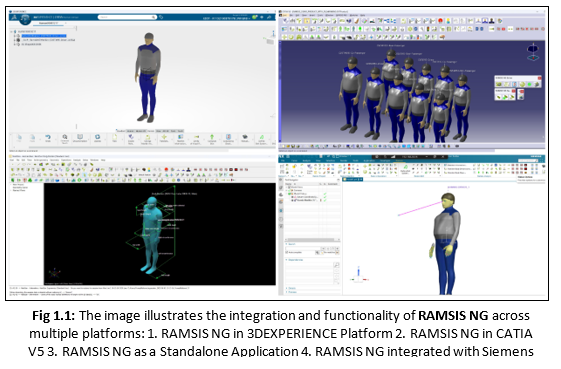
RAMSIS supports effortless integration with major
design platforms, including:

  • CATIA V5
  • 3DEXPERIENCE Platform
  • SIEMENS NX

It is also available as a standalone application,
providing flexibility for teams using varied design tools.

Broad Industry Applications

While RAMSIS is widely used in the development of passenger vehicles, commercial vehicles, defence, and aircraft, it has also gained significant traction among two-wheeler and three-wheeler OEMs. As these industries begin prioritizing ergonomic standards, RAMSIS offers a reliable way to evaluate rider posture, seat height, and control accessibility even at early stages.

The Advantage: RAMSIS’s Core Strengths Over Its Competitors

  1. Anthropometric Database
    One of RAMSIS’s most powerful differentiators is its extensive and validated anthropometric database.

Anthropometry is the scientific study of human body dimensions—such as height, limb length, joint angles, and sitting postures. It plays a vital role in ensuring that product designs are tailored to the target user population.

RAMSIS includes region-specific anthropometric data for nearly every major geography—except Africa—and supports multiple population groups, age ranges, and genders.

In India, RAMSIS incorporates the ARAI Size India Database, which is valid until 2040. This allows OEMs to design vehicles for future Indian populations. For instance, if you’re designing a car to launch in 2030, RAMSIS enables you to simulate what the average male and female body proportions will look like by then—ensuring future compliance and customer comfort.

  1. Scientifically Developed Posture Models
    Another major advantage of RAMSIS lies in its realistic posture models—carefully developed to reflect actual human body behaviour in different scenarios.

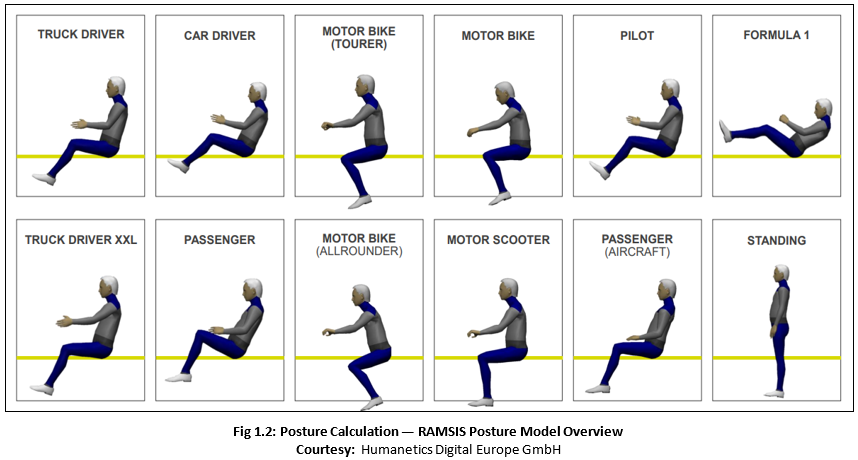
Posture models in RAMSIS are standardized, ergonomically optimized representations of how humans sit, stand, reach, or drive in real-world conditions. These aren’t arbitrary or algorithmically guessed poses—they’re the result of detailed empirical research.

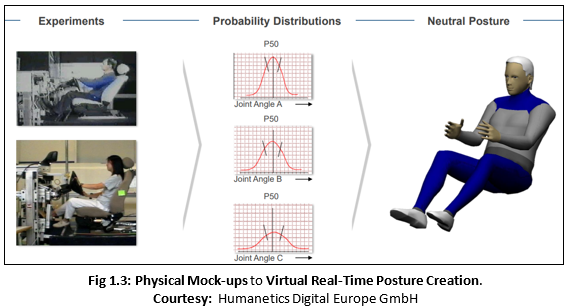
Humanetics Digital Europe GmbH (formerly known as Human Solutions) developed these posture models by conducting live physical studies. For every posture model—be it for a driver, passenger, or operator—more than 40 real participants were observed sitting or standing in the target position for up to 3 hours. Each participant was analysed for posture consistency, comfort, and biomechanical alignment, and the results were fed into RAMSIS’s model framework.

This hands-on, data-driven process ensures that RAMSIS posture models are scientifically validated and ergonomically optimized, offering unmatched realism compared to other DHM tools.


What’s New in RAMSIS NextGen

The latest version of RAMSIS—NextGen—features a refreshed interface, improved simulation accuracy, and greater flexibility for creating manikins. It supports more detailed analysis scenarios for both traditional and next-generation mobility solutions.

Conclusion

RAMSIS bridges the gap between digital design and real human experience. With its unmatched anthropometric database, scientifically validated posture models, powerful simulation capabilities, and seamless CAD integration, it enables OEMs to develop vehicles that are ergonomically sound, regulation-compliant, and ready for the future.

In the upcoming blogs, we’ll explore practical use cases, deep dive into RAMSIS modules, bodybuilder tools, and share real-world best practices for ergonomic validation across different vehicle platforms.

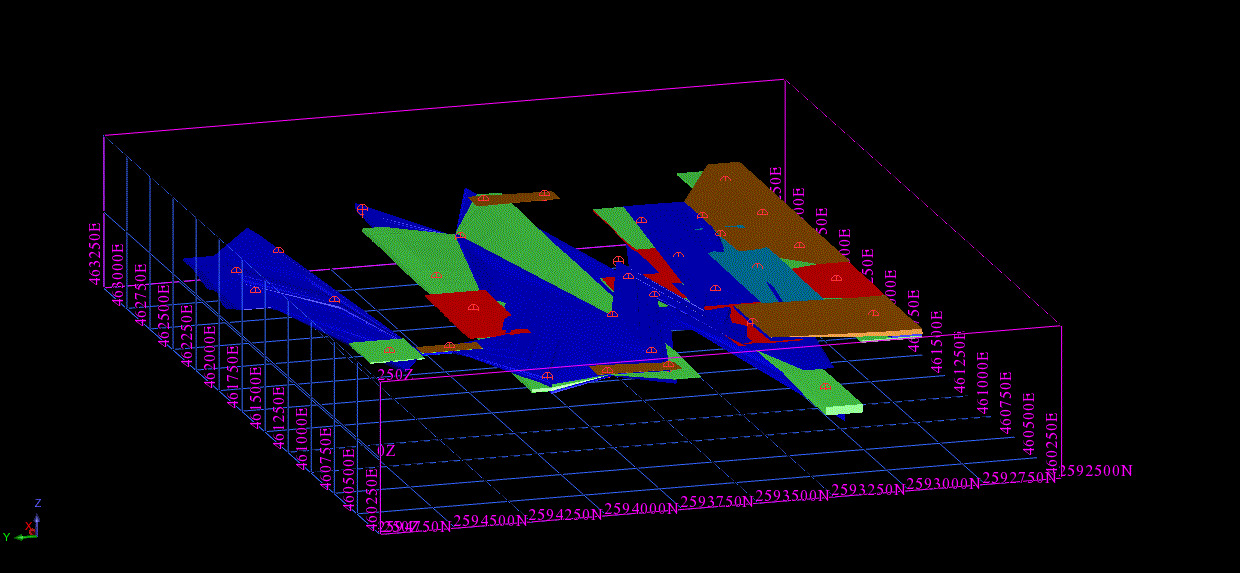
How an Efficient Geological Model Enhances Deposit Evaluation

In mineral exploration and mining, understanding the subsurface is everything. The success of any resource evaluation hinges on one critical component — the geological model.

This model isn’t just a technical requirement; it’s the foundation for informed decision-making, financial evaluation, and long-term mine planning. An efficient geological model transforms data into confidence — and that confidence drives value.


The Backbone of Mineral Resource Estimation

Mineral Resource estimation and classification rely heavily on the accuracy of the orebody’s geometry. That geometry is captured through a 3D geological model — a digital representation of what lies beneath the surface.

But creating that model isn’t simple. It’s shaped by structural and depositional complexity, which is initially defined through limited drilling information. At early project stages, geological interpretation must be done with caution, as the available data only tells part of the story.

As more information becomes available, the geological model must be updated and refined. This ensures that resource estimates remain well-constrained, reducing the risk associated with grade continuity assumptions and resource classification.


From Data to Understanding: The Power of Ongoing Refinement

The model’s refinement is a continuous process. Each new drillhole adds depth to the geological story — not just in data, but in interpretation. Along with updated grade statistics and spatial correlations, the working knowledge gained over the life of the mine plays a vital role. Familiarity with the deposit and the modeling software are also key.

Refinement ensures that the geological model stays current and reliable, leading to better decisions at every stage of the mining value chain.


Managing the Most Valuable Asset: Geological Data

In exploration and mining, geological data is the single most important input into any technical or financial assessment. It defines the location, geometry, and grade of the orebody — all critical for understanding the potential value of a deposit.

That’s why mining organizations invest heavily every year to:

  • Acquire new geoscientific data
  • Make new geological interpretations
  • Maintain, manage, and interrogate historical data

As analytical technologies and interpretation methods evolve, even older data can increase in value — provided it’s well curated.

But collecting the data is just the beginning.


Turning Data into Action with Geological Modeling

To make meaningful use of that data, companies must convert it into an accurate, reliable 3D geological model. That’s where tools like GEOVIA come in — helping teams visualize subsurface geology, test hypotheses, and make smarter decisions on surface and underground.

Efficient geological data management enables:

  • Better understanding of mineral distribution
  • More accurate risk assessments
  • Smarter mine planning and development
  • Operational excellence across the value chain

What Makes a Geological Model Work?

A 3D geological model is a digital, visual, and interactive representation of subsurface structures and rock properties. It integrates various data types — from drillhole logs and geophysical surveys to rock characteristics — to build a clear picture of what’s underground.

Creating this model involves four essential steps:

  • Data Collection and Analysis
    Gathering comprehensive data — including drillholes, geophysics, and geochemistry — to understand the geological setting.
  • Interpretation and Correlation
    Identifying geological structures like faults, folds, and mineralized zones. Correlating all available data builds a consistent geological narrative.
  • Model Construction
    Using specialized software such as GEOVIA to build a three-dimensional view that integrates all geological interpretations.
  • Validation and Refinement
    As new data becomes available, the model is updated and refined — ensuring it reflects the most accurate understanding of the subsurface.

Conclusion: The Strategic Value of Geological Modeling

An efficient geological model is more than a technical tool — it’s a strategic asset. It supports better decisions, reduces uncertainty, and unlocks the full potential of your mineral resource.

With the right processes, tools, and commitment to continuous improvement, your geological model becomes a source of confidence — from exploration through to production.


Subscribe to our newsletter

Get all the latest information on Events, Sales and Offers.