Extended Simulation of Wind Turbines Using ABAQUS

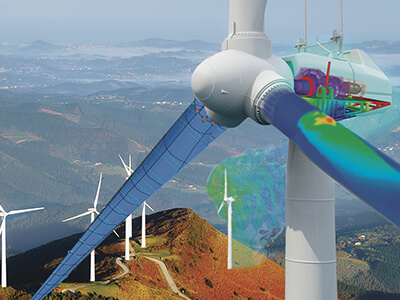
Wind turbines are pivotal in the global transition towards renewable energy systems. Accurate simulation of wind turbines using advanced finite element analysis (FEA) tools like ABAQUS enables engineers to design more efficient, reliable, and durable systems. In this blog, we will delve into the process of simulating wind turbines using ABAQUS, focusing on structural, aerodynamic, and fatigue analyses. 


Key Components of Wind Turbine Simulation 
  • Blade Analysis: Wind turbine blades endure complex loads, including aerodynamic forces, gravitational effects, and centrifugal forces. ABAQUS’ advanced material modeling capabilities are ideal for analyzing composite blades. 
  • Tower Structure: The tower must withstand wind loads and dynamic effects from the rotor. Structural stability under cyclic loads is crucial. 
  • Rotor-Nacelle Assembly: This component converts wind energy into mechanical energy. Simulation focuses on the interaction between rotating parts and the structural housing. 
  • Foundation: The foundation supports the entire structure, transferring loads to the ground. Soil-structure interaction plays a key role in ensuring stability. 

Extended Steps for Wind Turbine Simulation
  • Geometry Creation:
    • Create the geometry of the wind turbine using CAD software or directly in ABAQUS/CAE. This includes the blade, tower, rotor, nacelle, and foundation. 
    • The geometry should represent real-world conditions, incorporating precise measurements and aerodynamic designs.
  • Material Properties:
    • Assign material properties for each component. For example: 
    • Blades: Composite materials (e.g., carbon fiber reinforced polymers). 
    • Tower: Steel or other high-strength alloys. 
    • Foundation: Concrete or reinforced concrete
  • Meshing:
    • Generate a fine mesh for accurate results, particularly for critical regions like blade edges and tower connections. 
    • Use hexahedral elements for simpler shapes and tetrahedral elements for complex geometries. 
    • Perform mesh convergence studies to ensure solution accuracy.
  • Boundary Conditions:
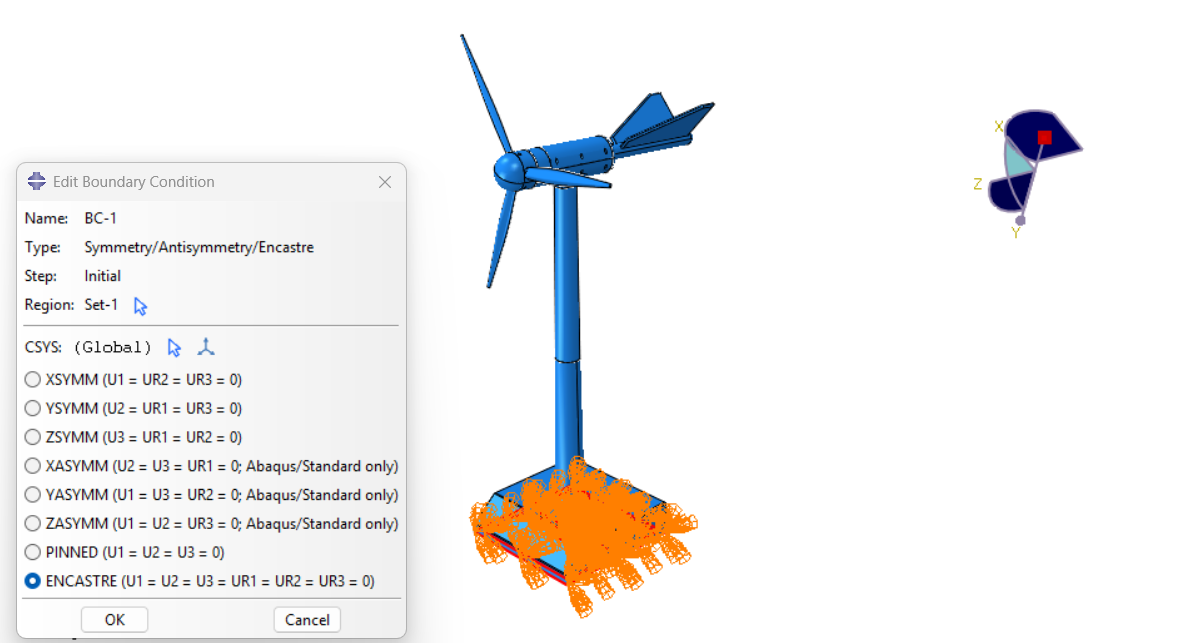
    • Fix the base of the tower to represent its connection to the foundation. 
    • Apply wind loads along the length of the blades and lateral forces on the tower. 
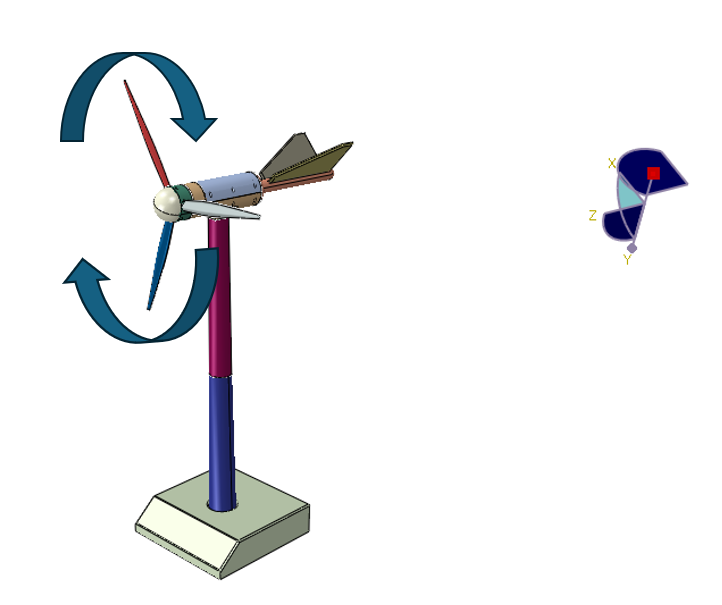
    • Include gravity and centrifugal forces for realistic loading conditions. 
  • Load Cases:
    • Static Loads: Simulate constant wind conditions for structural stability analysis. 
    • Dynamic Loads: Use time-varying wind loads for transient and fatigue analysis. 
    • Extreme Events: Model conditions such as gusts or shutdown scenarios. 
  • Analysis Setup:
    • Use the Static General step for structural integrity checks under steady loads. 
    • For time-dependent studies, employ the Explicit Dynamics or Implicit Dynamics solver. 
    • Include non-linear effects such as large deformations and material plasticity for blades and tower sections. 
  • Post-Processing:
    • Use ABAQUS/CAE’s visualization module to evaluate stress distribution, deformation, and vibration modes. 
    • Identify critical regions for design improvement, such as areas with high stress concentrations. 

Case Study: Blade Deformation 

Objective: 

To evaluate the deformation of a wind turbine blade under cyclic aerodynamic loads. 

Steps: 

  • Modeling: The blade was modeled with composite layups to represent real-world manufacturing processes. 
  • Loading: A cyclic wind load was applied over 1,000 load cycles.

Results: 

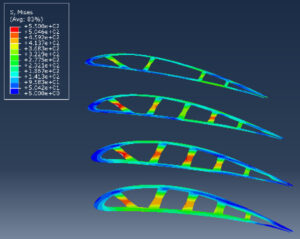
  • Stress concentrations were observed at the root of the blade. 
  • The fatigue analysis highlighted a potential failure region, prompting geometry and material modifications. 


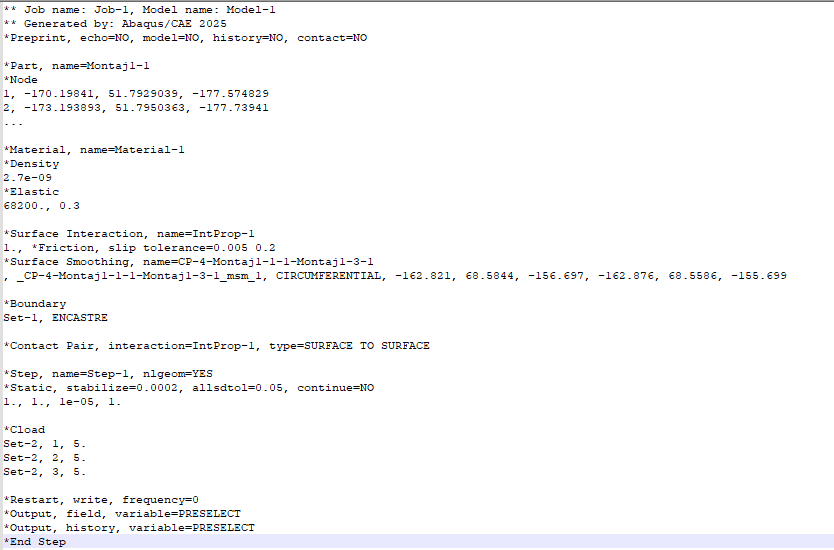
INP File for Blade Analysis 

Below is an example of a basic INP file setup for wind turbine blade analysis: 

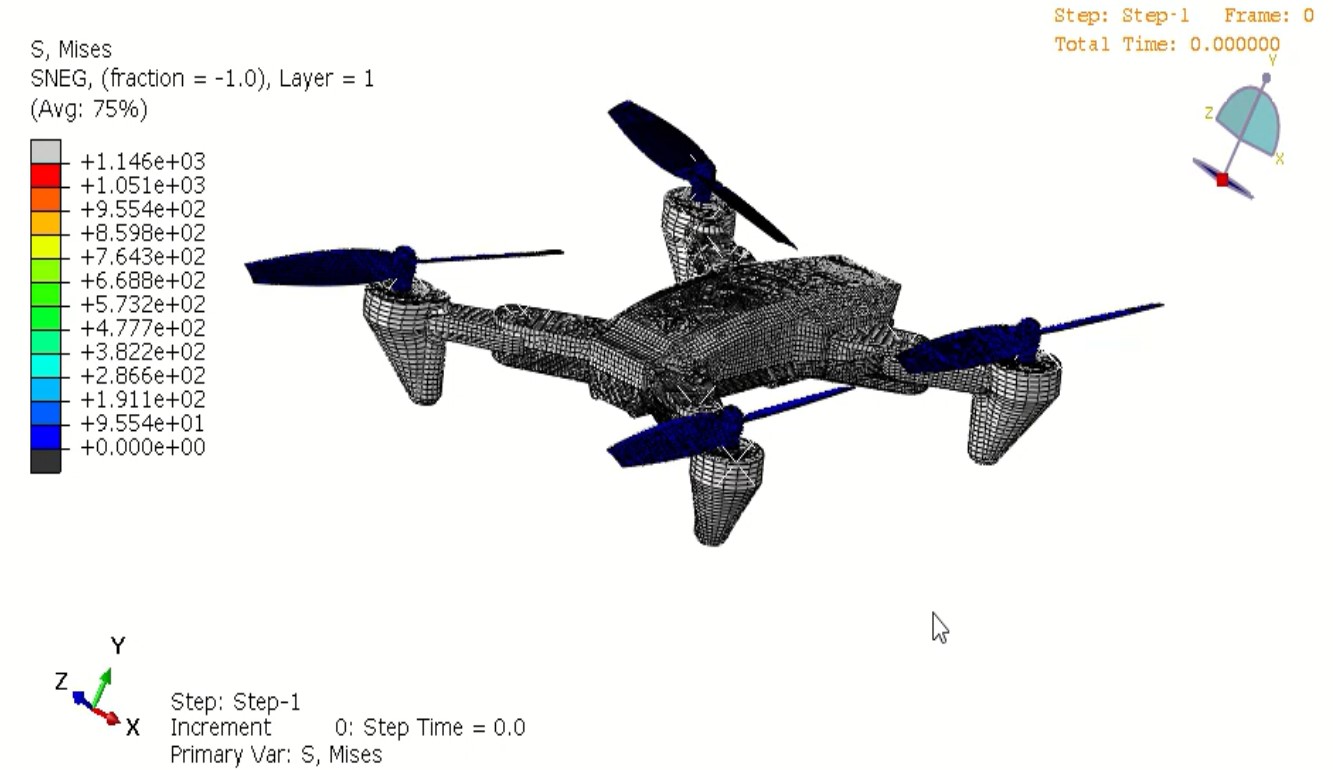
CAD, Meshed, and Result Images 

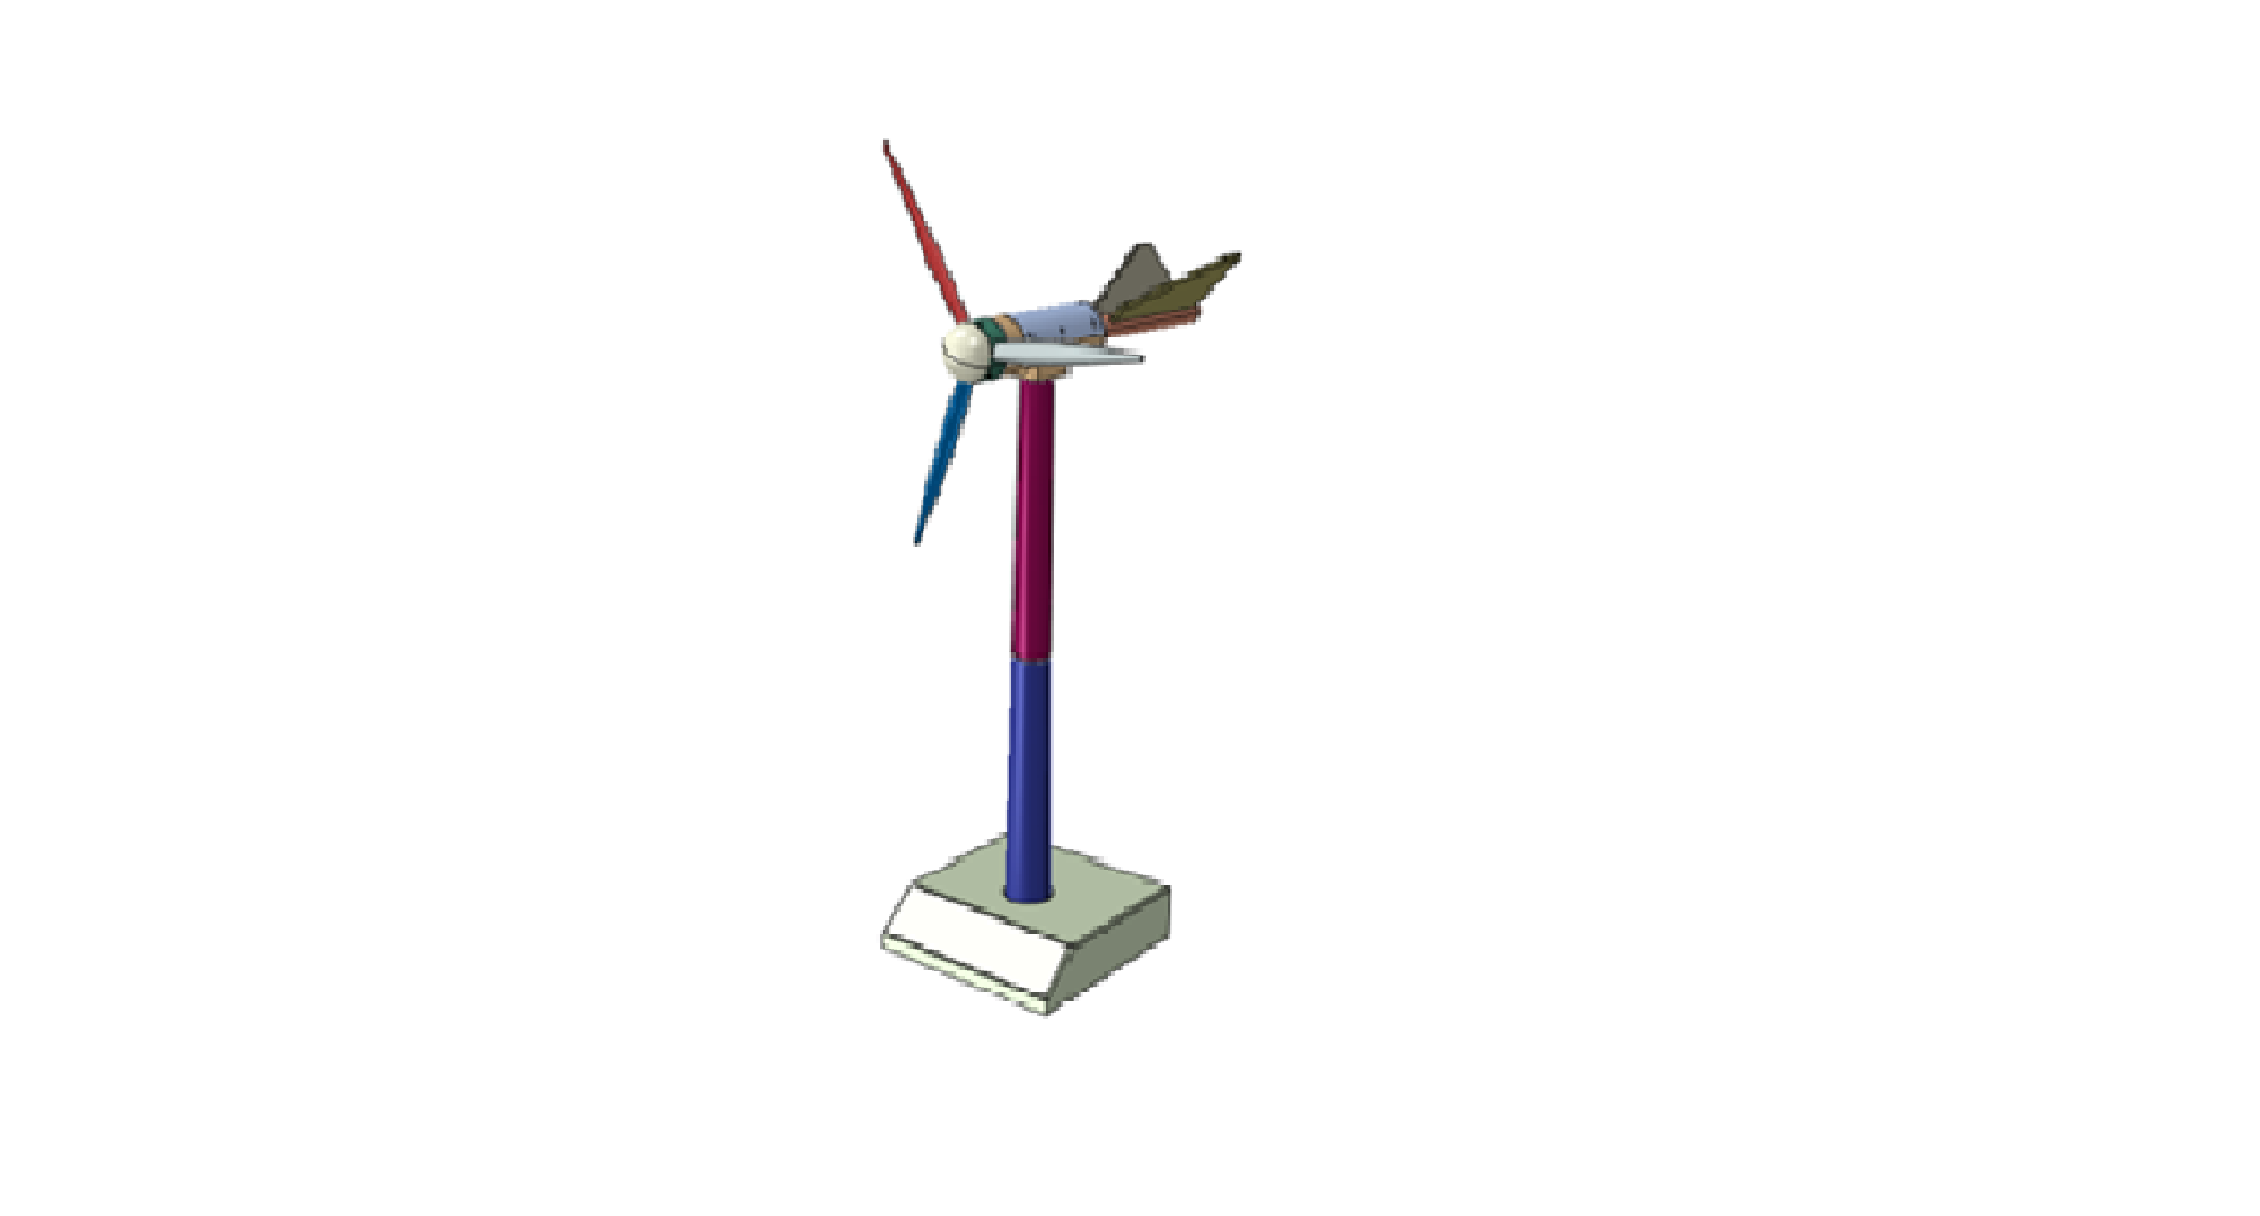
  • CAD Model of the Wind Turbine: 


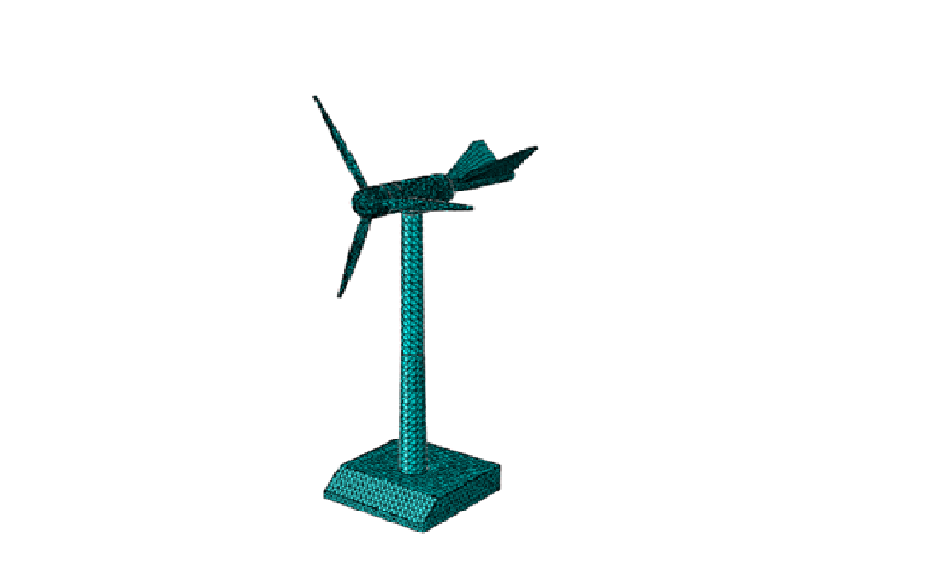
  • Meshed Model: 


Conclusion 

Simulating wind turbines in ABAQUS enables engineers to refine designs for efficiency and reliability. With detailed CAD models, accurate meshing, and comprehensive analysis, engineers can optimize turbine performance and reduce failure risks. Leveraging tools like ABAQUS for wind turbine simulation is a step towards achieving a sustainable energy future.
Leveraging GIS in Forestry: Revolutionizing Forest Management

According to the India State of Forest Report (ISFR) 2021, released by the Ministry of Environment, Forests, and Climate Change, India’s total forest area constitutes 21.71% of the country’s geographical area, while the tree cover is estimated to be 2.91%. Consequently, the combined coverage of forests and trees accounts for 24.62% of the nation’s geographical area. Geographic Information Systems (GIS) have emerged as a cornerstone for effective forest management and conservation. By integrating diverse datasets and offering sophisticated spatial analysis tools, GIS empowers foresters, ecologists, and conservationists to make data-driven decisions, optimize resource allocation, and effectively address pressing environmental concerns. 


Mapping Forest Resources

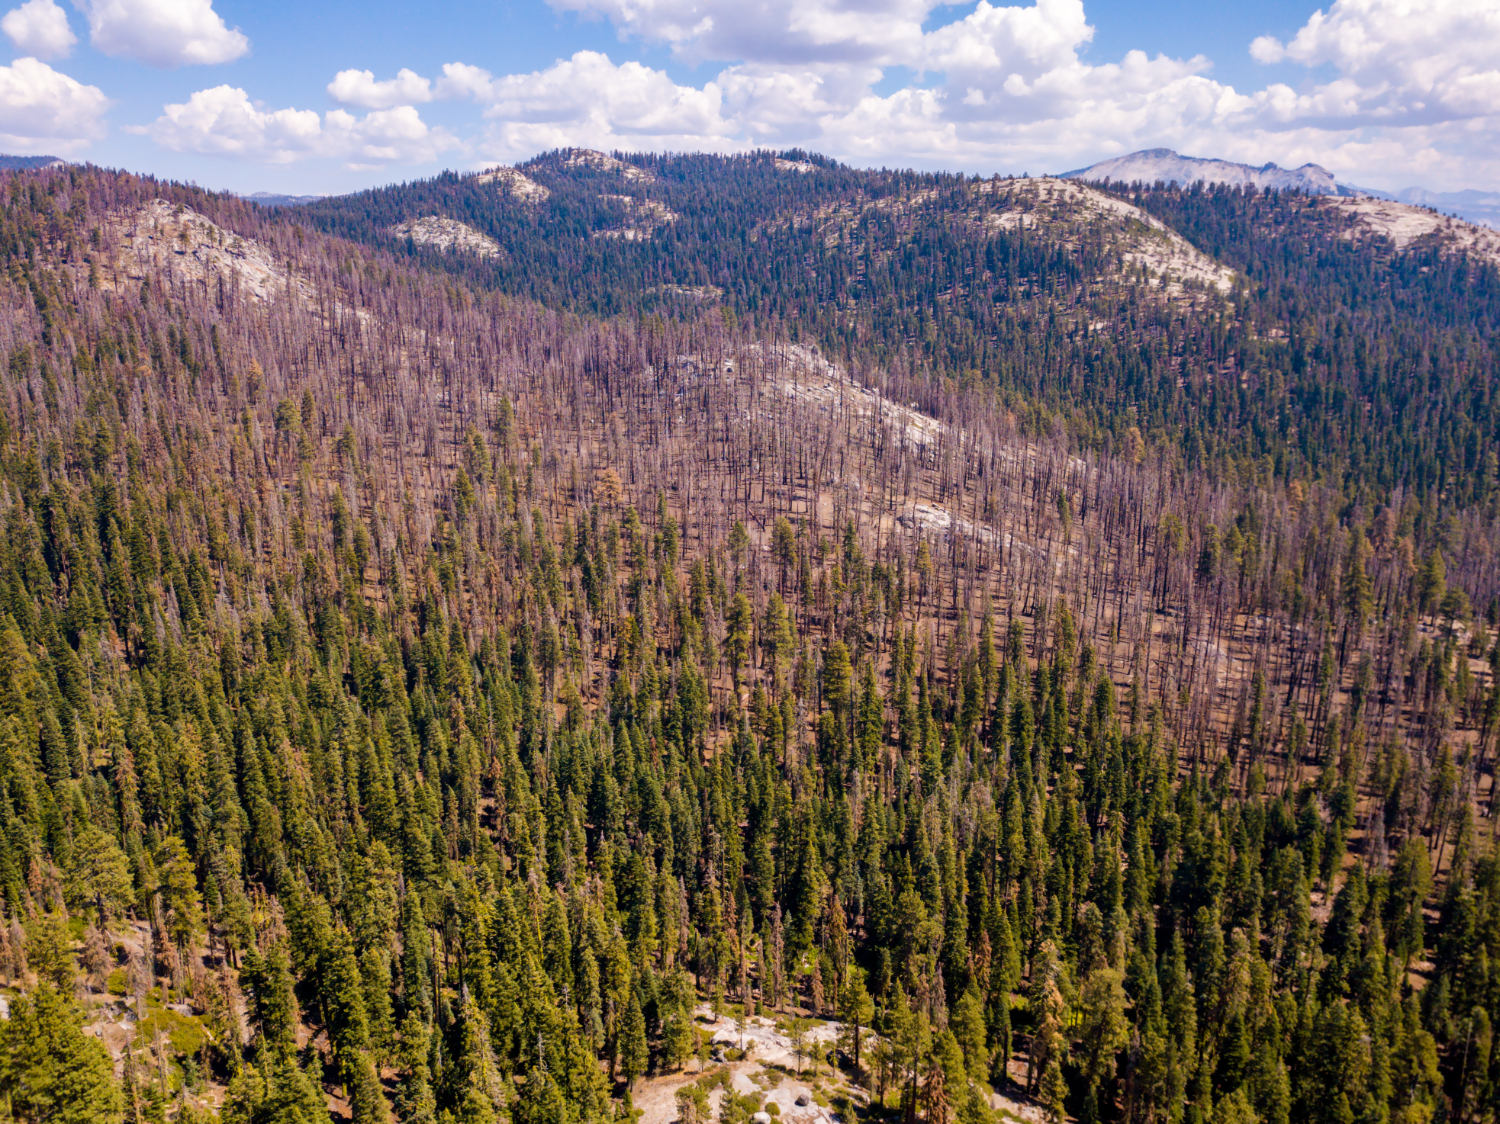
GIS plays a crucial role in generating comprehensive maps that provide detailed insights into forest composition, structure, and ecological health. High-resolution satellite imagery and aerial surveys are integrated within GIS platforms to produce accurate and up-to-date forest maps. These maps enable forest managers to effectively monitor changes in forest cover over time, such as deforestation, forest degradation, and the impacts of natural disturbances like wildfires and storms.


Forest Planning and Management

Regular updates and revisions are essential to sustain forest preservation efforts and enhance green cover. The forest department leverages GIS and remote sensing technologies to improve its capabilities by providing critical input data such as forest density, forest type, and land resources. Additionally, GIS enables the inclusion of maps detailing road networks, settlements, and water bodies, facilitating the design of efficient management strategies. 


Wildfire Risk Assessment and Management

Wildfires pose a substantial threat to forest ecosystems worldwide. GIS serves as an invaluable tool for effective wildfire management by providing real-time data on fire behavior, prevailing weather conditions, and fuel availability. This critical information supports accurate predictions of fire spread, facilitates the planning and execution of fire suppression activities, and enables the strategic design of firebreaks. Furthermore, post-fire analysis conducted within a GIS environment assists in assessing the extent of damage and developing comprehensive restoration plans. 


 Forest Management

GIS and Remote Sensing technologies are essential for effective forest monitoring, allowing for the creation of detailed, digital maps of forests with irregular boundaries. Periodic updates provide accurate insights into forest changes, supporting the development of sustainable management strategies and disaster mitigation plans. Advanced satellite and drone imagery, along with techniques like False Colour Composite (FCC) and True Colour Composite (TCC), enable precise monitoring of forest coverage, with FCC enhancing features not visible to the human eye, aiding in the detection of forest cover changes. 


Habitat Mapping and Biodiversity Conservation

Forests serve as vital habitats for a diverse array of flora and fauna. GIS plays a pivotal role in habitat mapping and biodiversity conservation by enabling the identification of critical habitats and biodiversity hotspots. Through spatial analysis, GIS facilitates the assessment of habitat fragmentation, connectivity, and the impact of human activities on wildlife populations. This valuable information empowers conservationists to effectively design and implement protected areas, establish wildlife corridors, and develop comprehensive management plans that safeguard biodiversity. 


Conclusion

The integration of GIS in forestry has transformed the way forests are managed and conserved. From mapping and monitoring, planning to disaster management, GIS provides the tools and insights necessary for sustainable forest management. As technology continues to advance, the role of GIS in forestry will only become more critical, helping us protect and preserve our valuable forest ecosystems for future generations. 

By leveraging the power of GIS, we can ensure that our forests remain healthy, resilient, and productive, supporting biodiversity and providing essential ecosystem services. 

Revolutionizing the Agriculture Sector with Data Driven GIS Solutions

Geographic Information Systems (GIS) is emerging technology in India which is growing at a compound annual growth rate (CAGR) of 13.45 per cent. The application has solutions right from transport and mobility, retail, infrastructure, agriculture to homeland security. The agriculture sector has seen a massive growth with the GIS solution to improve the efficiency and productivity of farming operations right from crop cultivation decisoin, monitoring, irrigation market analysis, logistic to insurance. 

GIS technology plays a crucial role in modern agriculture by providing spatial data and analytical tools that help farmers make informed decisions, leading to increased productivity and sustainability. 

Here are some key applications:  

  • Soil Analysis 
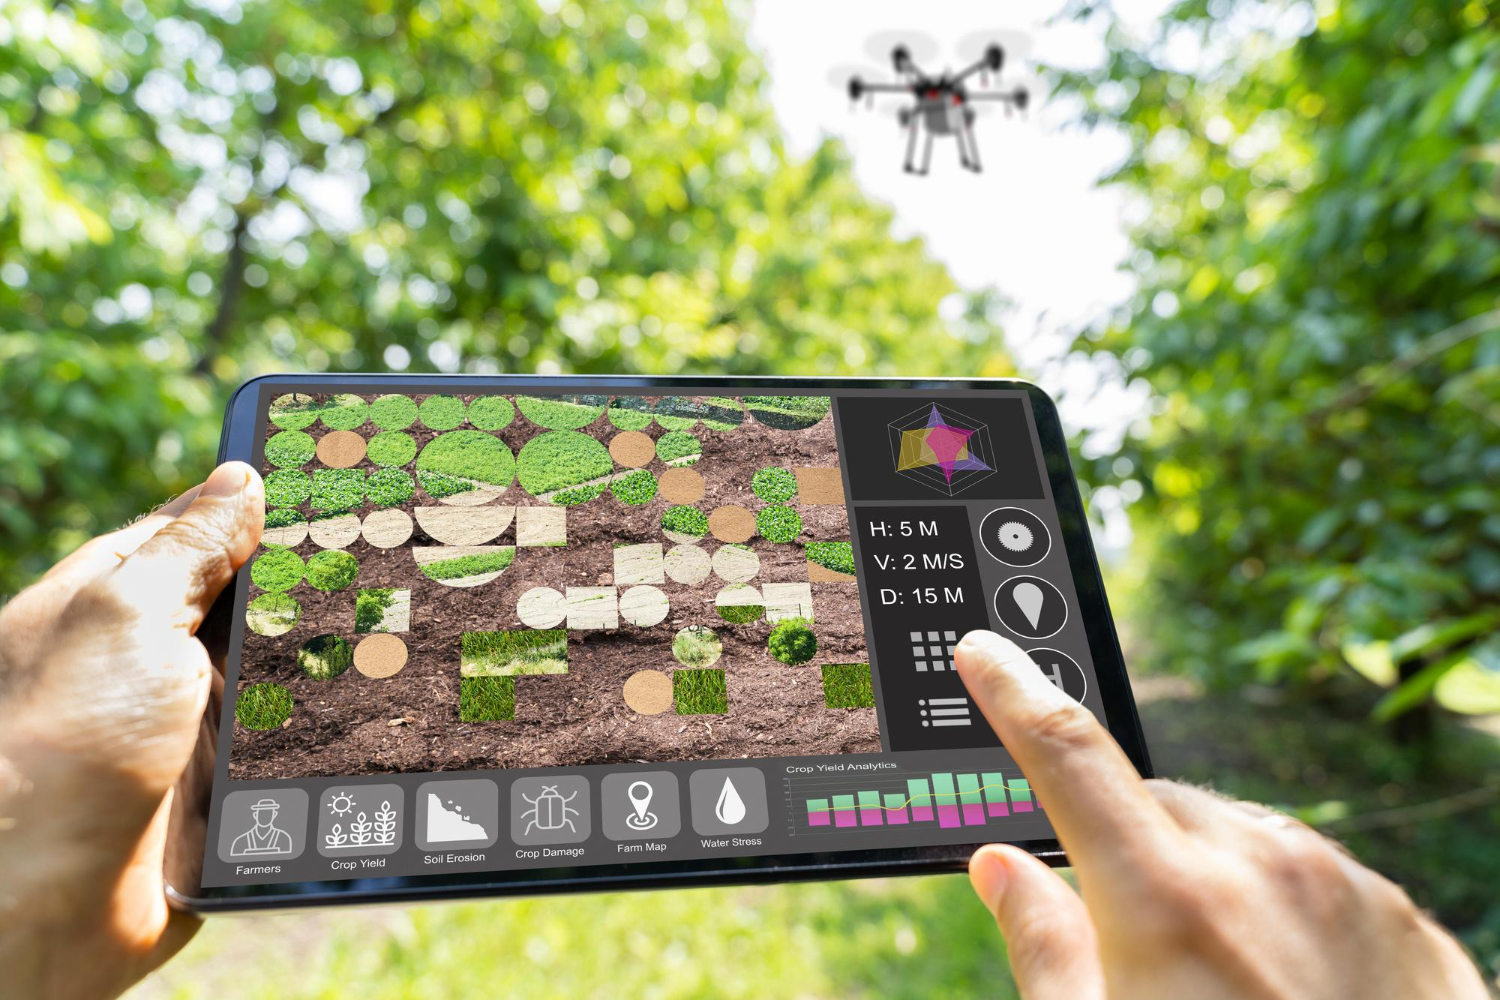
  • Precision Farming 
  • Crop Monitoring 
  • Irrigation Management 
  • Yield Prediction 
  • Farm Planning and Management 
  • Crop Insurance 

Soil Analysis 

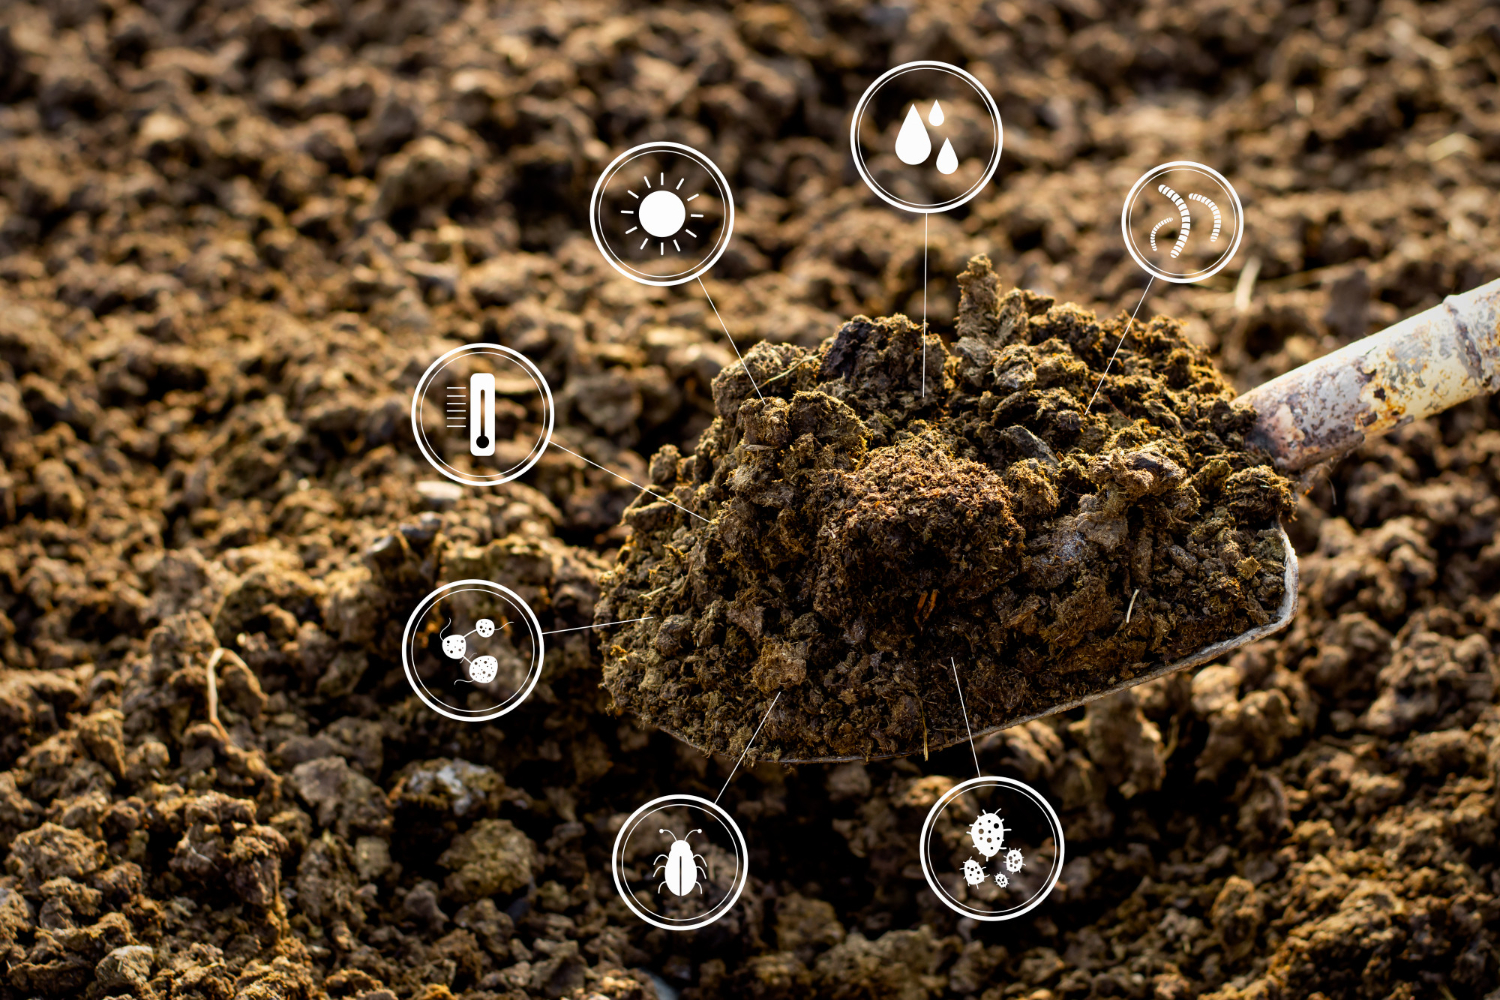
By spatially mapping soil types and their inherent properties, GIS facilitates a comprehensive understanding of soil health and fertility. This spatial analysis enables informed decisions regarding optimal crop selection and the precise application of soil amendments, ultimately enhancing agricultural productivity and resource efficiency.


Precision Farming  


Integrating spatial data on soil characteristics, crop health, and environmental conditions, GIS empowers farmers to implement precision farming practices. This data-driven approach enables optimized resource management through site-specific application of inputs such as fertilizers and pesticides. Consequently, farmers can minimize waste, reduce environmental impact, and enhance crop yields by tailoring agricultural practices to the unique requirements of each field area. 


Crop Monitoring

By enabling continuous monitoring of crop conditions and growth patterns. Leveraging satellite imagery and remote sensing data, farmers gain valuable insights into crop health. This allows for early detection of potential issues, such as disease outbreaks or pest infestations, facilitating timely interventions and optimizing crop management strategies. 


Irrigation Management

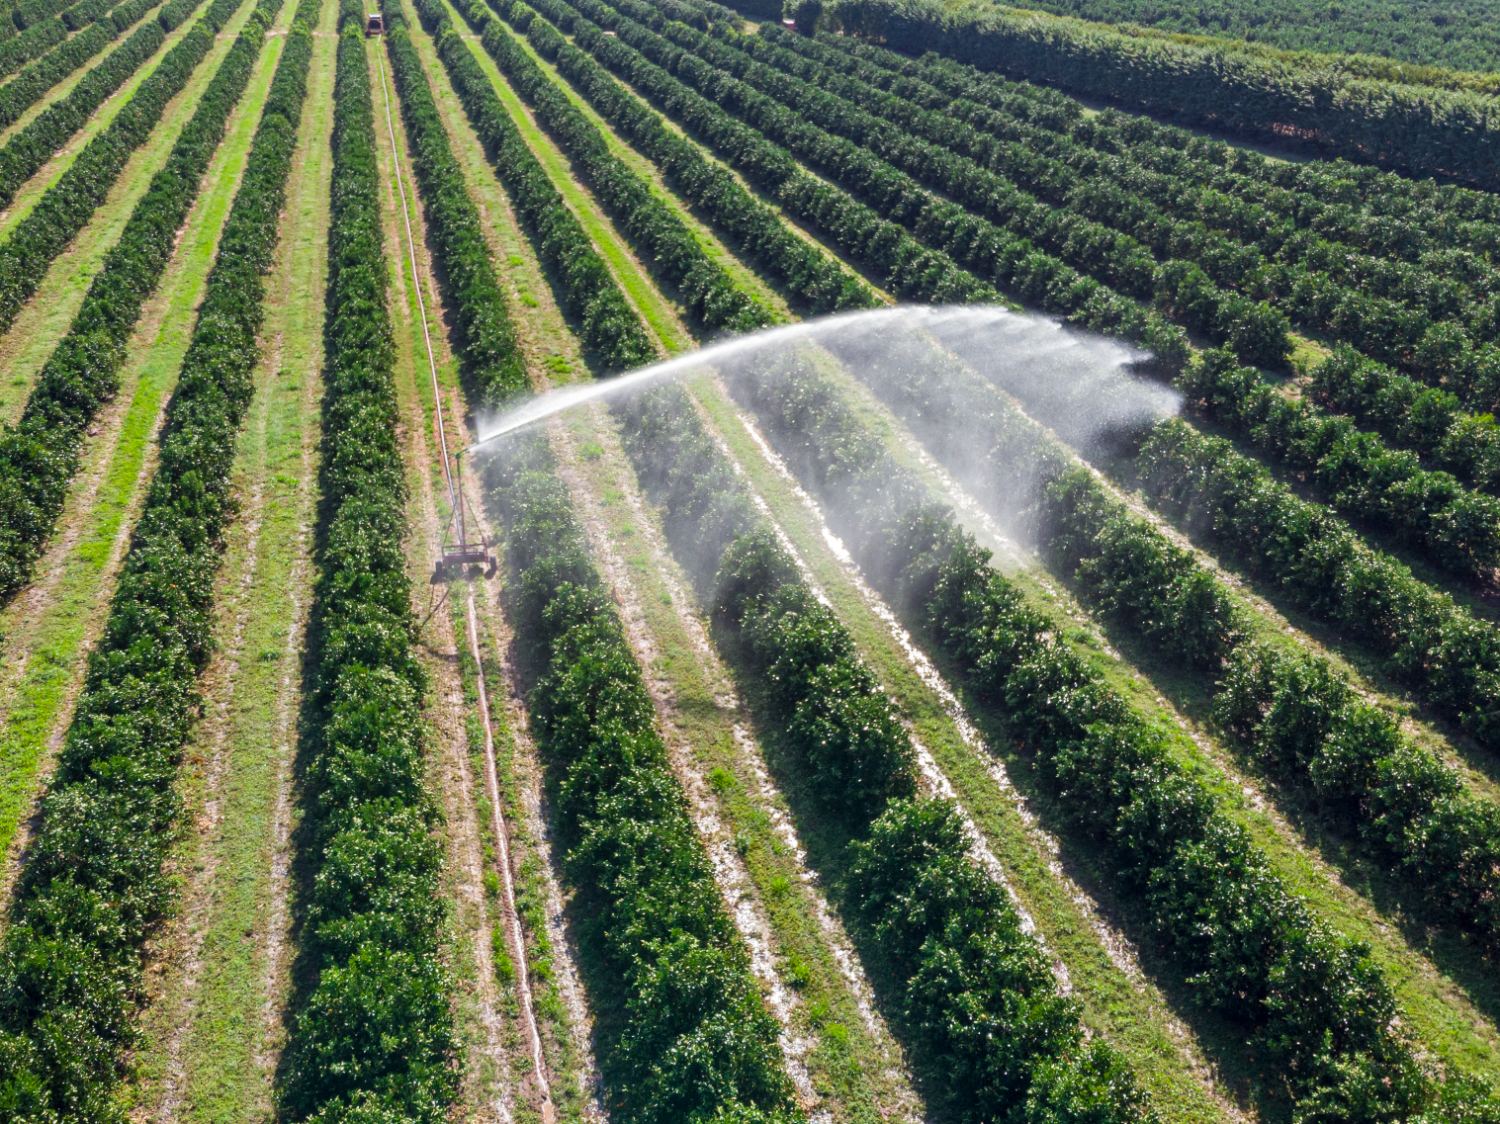
The design of efficient irrigation systems by enabling the mapping of water resources and soil moisture levels. This spatial analysis allows for precise irrigation scheduling, ensuring crops receive the optimal amount of water at the appropriate time. Consequently, water resources are conserved, and crop health is significantly improved.


Yield Prediction

By analyzing historical yield data in conjunction with current crop conditions, GIS facilitates accurate crop yield prediction. This valuable information empowers stakeholders in the agricultural sector, including farmers, processors, and distributors, to effectively plan and manage supply chains, ensuring efficient resource allocation and mitigating potential market disruptions. 


Farm Planning and Management

GIS provides critical support for the planning and management of farm operations. By facilitating the spatial analysis of farm layouts, crop rotation schedules, and the distribution of farm infrastructure, GIS enables optimized land use and streamlined farm management practices. This integrated approach contributes to increased efficiency and improved overall farm productivity. 


Crop Insurance

GIS technology allows insurers to accurately map and analyze agricultural areas, identify potential hazards, and monitor crop health. By integrating satellite imagery, weather data, and historical crop performance, GIS provides comprehensive insights that help insurers make informed decisions, set fair premiums, and expedite claims processing. This advanced approach not only mitigates financial risks for farmers but also ensures timely support, fostering a more resilient agricultural sector. 


Market Analysis

GIS empowers businesses to conduct sophisticated market analyses by providing valuable insights into market trends and optimizing transportation logistics. By integrating spatial data on consumer demographics, competitor locations, and market demand, GIS facilitates the identification of optimal locations for sales outlets and distribution centers, ultimately enhancing market penetration and profitability. 


Conclusion 

By leveraging GIS technology, farmers can optimize resource use, enhance crop management, and make data-driven decisions that lead to higher yields and sustainable practices. From soil analysis and irrigation management to crop monitoring and disaster preparedness, the applications of GIS are vast and impactful. As the agricultural sector continues to face challenges such as climate change and the need for increased food production, GIS provides a powerful tool to meet these demands. 


Reach out to us to deep dive into the technical capabilities and understand how GIS is transforming the agriculture sector with data-driven information. 

Optimizing Spacecraft Performance with Abaqus: Enhancing Reliability and Efficiency in Space Missions

Technology Innovation

The space industry has always been at the forefront of technological innovation, where precision, reliability, and performance are paramount. With the increasing complexity of space missions, from satellite launches to deep space exploration, the engineering challenges are vast. One of the most critical tools for tackling these challenges is simulation, particularly Finite Element Analysis (FEA), which plays a vital role in analysing and optimizing components and systems under the extreme conditions of space.


Simulating Physical Behaviour using ABAQUS

Among the most popular simulation software in engineering, Abaqus stands out as a powerful tool for simulating the physical behaviour of structures and materials in a wide range of industries, including aerospace and space exploration. In this blog, we’ll explore how Abaqus is used for engineering simulations in the space industry, with a focus on its capabilities, applications, and the value it brings to space missions.


Simulation in Space Engineering

Engineering simulation is crucial in the space industry due to the extreme conditions spacecraft and components face. These include:

  • High levels of vibration during launch,
  • Thermal extremes, from freezing cold in space to extreme heat during re-entry,
  • Microgravity effects, which alter the behavior of materials and structures,
  • Radiation exposure, which can degrade material properties over time.


Real-World Applications of Abaqus in the Space Industry:

Abaqus has been employed in numerous applications within the space industry. Below are a few notable examples:

  • Satellite Structural Analysis

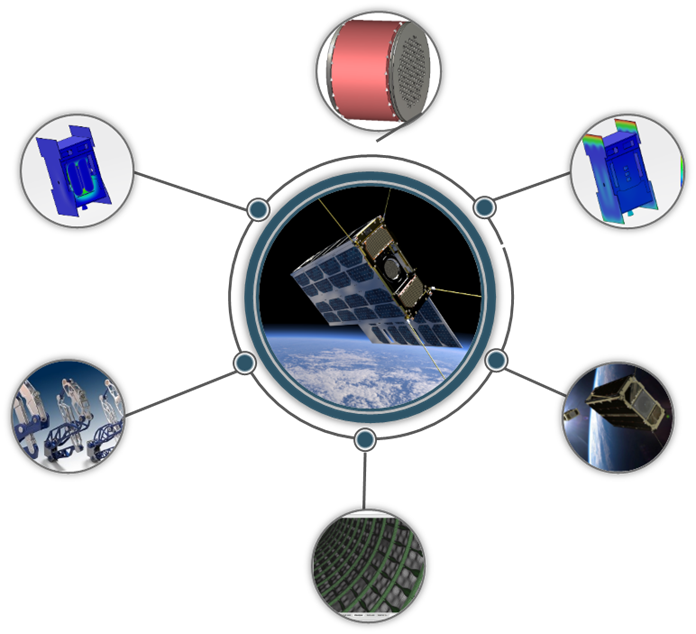
Satellites, whether in low Earth orbit (LEO) or deep space, must endure high vibrations during launch and the harsh conditions of space. Using Abaqus, engineers can model the satellite’s structure, including antennas, solar panels, and propulsion systems, to evaluate their behavior under launch loads and space conditions. The software helps in optimizing structural designs for minimal mass while maintaining high strength, which is essential in space missions.

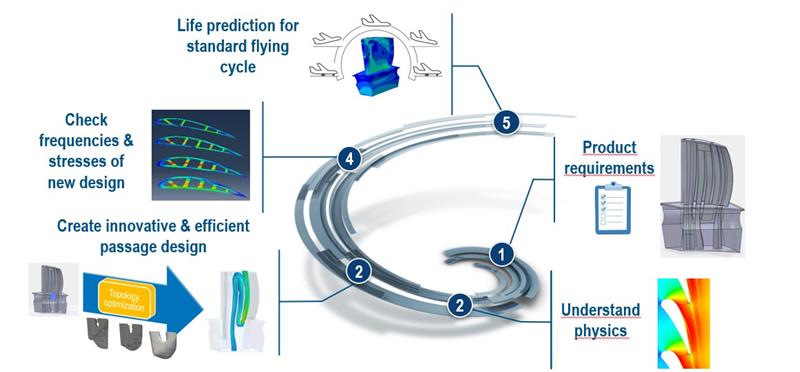
Fig:1: Simulation Driven Design Process


Fig 2: Linear Static FE Analysis with Rotational Body Force & Pressure Load


  • Rocket Propulsion Systems

The performance of rocket engines is critical to the success of space missions. Abaqus is used to simulate the structural and thermal behavior of propulsion systems, including engines, turbines, and combustion chambers. Thermal stresses, pressure loads, and the material response to extreme heat are analyzed to predict failure points, ensuring that propulsion systems can withstand the intense conditions during launch and space travel.

  • Thermal Protection Systems (TPS)

During re-entry, spacecraft experience high levels of heat that can cause catastrophic damage if not properly managed. Abaqus is commonly used to model and simulate Thermal Protection Systems (TPS), such as the heat shields found on space capsules. By modeling the heat flow and material degradation during re-entry, engineers can ensure that the TPS will perform optimally to protect the spacecraft and its crew.

  • Landing Gear Systems

In the design of spacecraft landing systems, such as the legs and wheels of lunar or Mars rovers, Abaqus plays an essential role in simulating the mechanical performance under landing impacts. These systems need to absorb high-impact forces while maintaining structural integrity, and Abaqus is used to optimize the design for the best balance of strength and weight.

  • Spacecraft Docking Systems

The docking mechanisms on spacecraft must function flawlessly under varying loads and conditions. Abaqus helps simulate the structural interaction between docking systems, considering factors like docking speed, pressure forces, and misalignments. This ensures that docking mechanisms are both safe and reliable, preventing damage during the process.


Benefits of Using Abaqus in the Space Industry
  • Cost and Time Efficiency: By identifying potential issues early in the design process, Abaqus helps reduce the need for costly physical tests and prototypes.
  • Design Optimization: Abaqus allows engineers to optimize the design of spacecraft and components to improve performance while reducing weight, which is essential for mission success.
  • Risk Mitigation: Through accurate simulation, potential failure modes can be identified and addressed, reducing the risk of mission failure.
  • Multi-disciplinary Analysis: The software integrates multiple physics domains, providing a holistic understanding of how different systems interact within a spacecraft or space vehicle.

Conclusion

In the space industry, where precision and reliability are non-negotiable, simulation tools like Abaqus are invaluable. They provide engineers with the ability to predict how spacecraft and their components will behave under extreme conditions, enabling the design of safer, more efficient, and cost-effective space missions. As the space industry continues to evolve, tools like Abaqus will remain at the forefront, helping to push the boundaries of space exploration and technology.

Revolutionizing Drone Design with Composites and SIMULIA’s Advanced Simulation Capabilities

Understanding the Role of Composites in Drone Engineering

Composites have emerged as a game-changer in the design and development of drones, offering unparalleled benefits in weight reduction, structural strength, and durability. These materials enable engineers to craft lightweight airframes without compromising on performance, which is critical for extending flight time, improving payload capacity, and enhancing overall efficiency. The use of advanced composites, such as carbon fiber-reinforced polymers (CFRP), allows for innovative designs that can withstand demanding operational conditions, making them the preferred choice for drone manufacturers across industries. 


Challenges in Designing Composite Structures for Drones

Despite their advantages, designing composite structures for drones presents unique challenges. The anisotropic nature of composites requires precise analysis of material behavior under various load conditions, including aerodynamic forces, thermal stresses, and impact resistance. Additionally, achieving optimal ply orientations and layups demands advanced design and simulation tools. These challenges necessitate a robust platform that can accurately model and simulate composite performance under real-world scenarios. 


Leveraging SIMULIA for Composite Drone Simulation

SIMULIA, part of the Dassault Systèmes 3DEXPERIENCE platform, is at the forefront of advanced simulation technologies for composite structures. It offers an integrated suite of tools that enable engineers to design, analyze, and optimize drone components with unmatched accuracy and efficiency.


  • Advanced Composite Analysis:

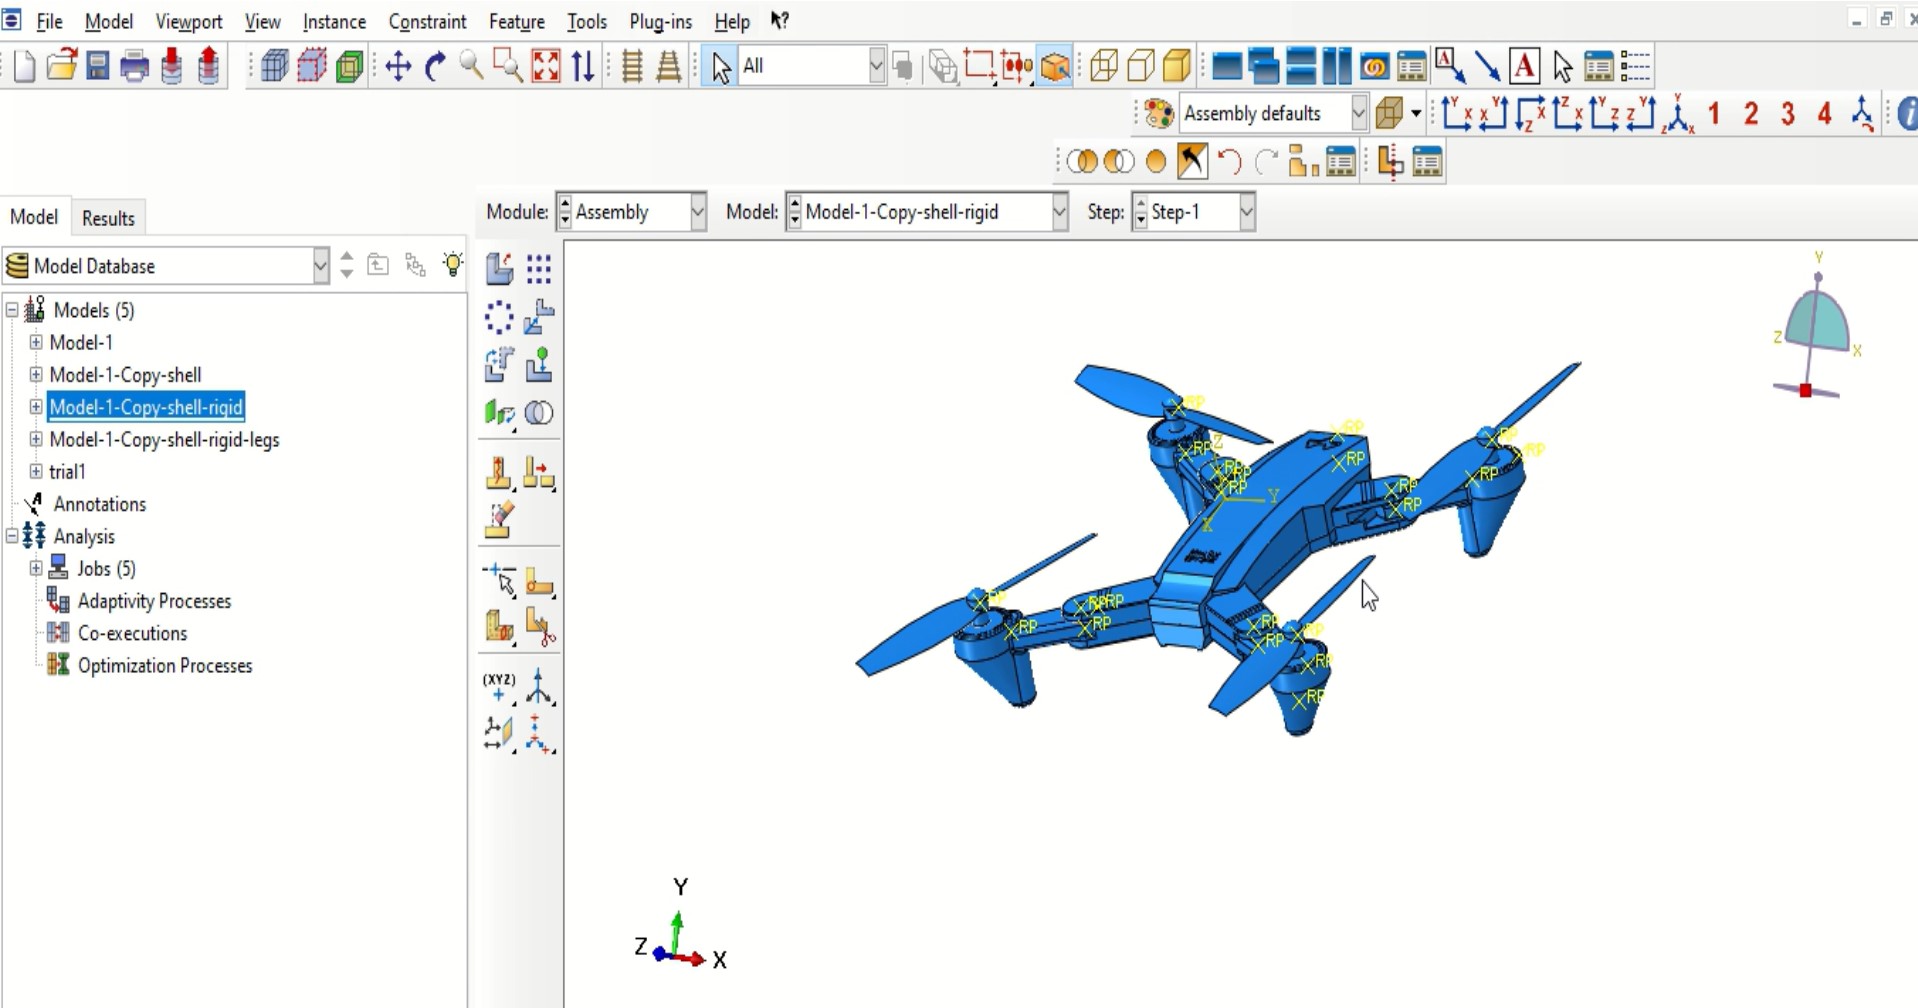
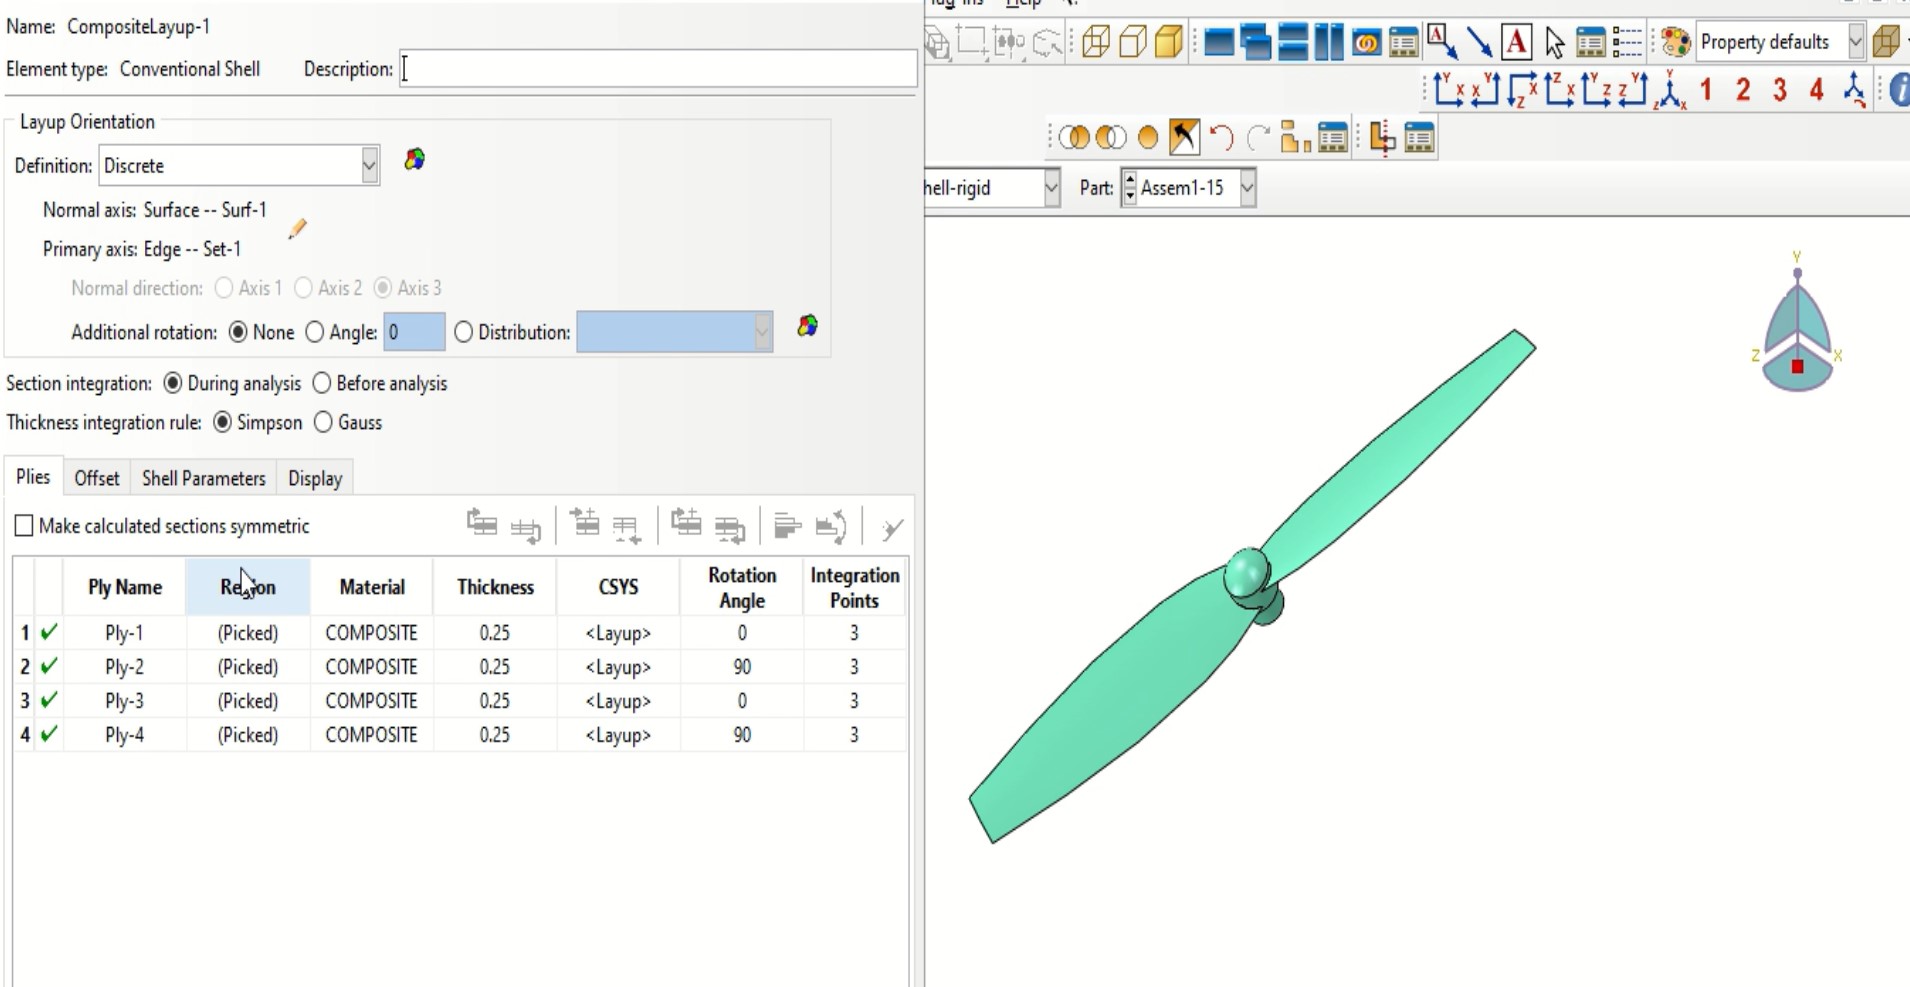
    SIMULIA’s Abaqus/CAE provides comprehensive tools for modeling composite materials, including ply-level analysis, progressive damage modeling, and delamination prediction. These capabilities are essential for evaluating the structural integrity and performance of drone components under various flight conditions. 

  • Lightweighting and Optimization:

    Using SIMULIA’s TOSCA Structure, engineers can perform topology optimization to design lightweight yet robust composite structures. This is critical for maximizing flight efficiency and payload capacity. 

  • Multiphysics Simulation:

    The platform allows for coupled multiphysics analysis, enabling the assessment of how thermal, structural, and aerodynamic forces interact with composite components during operation. This holistic approach ensures that drones perform reliably in diverse environments. 

  • Producibility Analysis:

    SIMULIA’s composite simulation tools include producibility analysis, allowing engineers to evaluate manufacturability early in the design phase. By predicting potential defects such as wrinkles or gaps during ply layup, the platform ensures cost-effective and high-quality production. 

  • Fatigue and Impact Testing:

    For drones subjected to repetitive loading or potential collisions, SIMULIA’s fatigue and impact simulation capabilities provide insights into material behavior over time. This helps in designing components that can withstand real-world operational stresses. 


Enhancing Drone Design with Virtual Twin Technology

The integration of SIMULIA with the 3DEXPERIENCE platform enables the creation of virtual twins, digital replicas of drone systems that simulate real-world performance. Virtual twins empower engineers to test various design iterations, optimize configurations, and validate performance before physical prototyping, significantly reducing development time and costs. 


Conclusion

The combination of composites and SIMULIA’s advanced simulation tools is transforming drone engineering, allowing for the development of lightweight, durable, and high-performance drones. By leveraging SIMULIA’s comprehensive capabilities—from composite modeling and optimization to producibility and fatigue analysis—engineers can address the challenges of drone design with precision and efficiency. As the drone industry continues to expand across sectors, SIMULIA ensures that manufacturers remain at the cutting edge of innovation, delivering systems that meet the highest standards of performance and reliability. 

Ensure right product data quality throughout the product development phase with Q-Checker

What is Product Data Quality and Why it Matters the Most 

Product Data Quality: The What’s and Why’s 

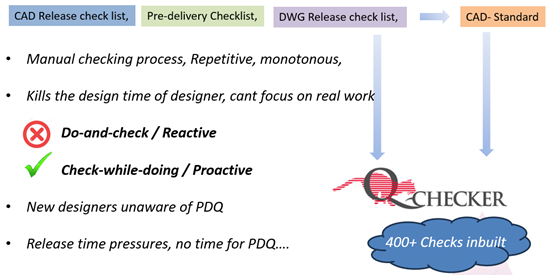
Product Data Quality comprises of creating, ensuring, distributing acceptable quality of CAD designs across the organisations and in upstream or downstream uses as well.e.g. Tier-1 Suppliers and or Original Equipment Manufacturers, OEMs. Correct part specifications pertaining to ensuring if material, coatings, thickness, GD&T annotations has been added to the designs or they are missed due to Human errors. Ensuring product data Quality despite of all the traditional methods like ‘Release check lists’, ‘Pre-delivery Check list’, ‘Drawing check list’, adherence to CAD standards of company is not enough and they have many drawbacks as mentioned below. The business risk arising due to bad data quality is enormous since bad data quality can significantly delay the entire product development Milestone-Releases, and as a company there must be a robust solution in place to factor this risk well in advance. CAD data either in PLM/PDM systems or in central servers is a master-print that all the stake holders in a development cycle refer-to, work-upon and rely upon. In all matters of engineering disputes, CAD data is a master that all refers to always and hence there are many organisations that count data quality as a risk factor project risks document. this clearly describes the importance of data quality. 


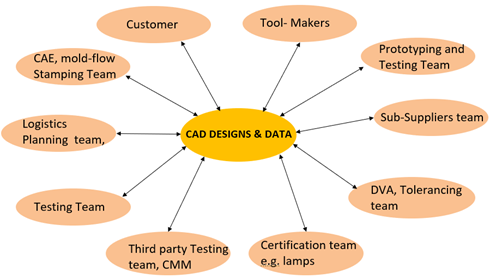
Fig 1: list of Stake holders using product data in a typical development cycle. 

Emphasising fro figure 1 how multiple stake holders has to-and-fro communications with the Product data. Any discrepancy in cad arising out from mediocre CAD modelling, missing specifications, unwanted geometries showing up, GD&T callouts and datums incorrectly specified will create these stake holders hold up their work. 


Fig 2: Traditional methods to ensure product data quality (PDQ) in organisation and drawbacks of it.


Benefits of Q-checker in Product Data Quality
  • Save Time Spent Fixing Models: Fixing geometry problems constitutes a significant design cost, not only in terms of time and quality, but also in wasted human and material resources. The repairs that are not made at the outset are often compounded when users of different downstream applications use different methods to “fix” the original model. With Q-Checker, critical defects can be identified and repaired before faulty features lead to additional geometric problems. 


  • Pro-Active Learning: The learning curve can be steep and tedious at times, particularly for new and part-time designers who need to conform to specific customer CAD standards. Q-Checker can assist by identifying common design process mistakes and inefficient practices. Like supporting each designer with the experience and advice of an expert user. 


  • Promotes Design Reuse: Because defects have traditionally been so common in models, most users prefer to rebuild their own, instead of reusing existing ones. This is another costly part of designing that Q-Checker can help to eliminate. 


  • Enforcing Internal CATIA Standards: Q-Checker helps to ensure that corporate design standards and specifications for using CATIA are adhered to, allowing the design and production teams to become more productive, efficient, thereby supporting higher product quality. 


  • Supplier Confidence: OEMs working with Q-Checker have the confidence that they are sending their suppliers good quality data. At the same time, they can insist that their suppliers use a specific checking profile. Suppliers who use Q-Checker can assure their customers and partners that they are delivering accurate models that are based on a consistent and disciplined CAD modelling practices. 


  • Check Files Transferred from Other CAD Software: CATIA users frequently need to use multiple CAD systems and data, a practice that can lead to problems with data translation. This usually calls for significant reworking and redesigning. Q-Checker helps to catch errors and adjust standards quickly and effectively, allowing for speedy recovery. 


  • Check Seal: Q-Checker allows users to store the model results in a check seal. This provides still greater security and helps to save time since the receiving part does not have to be rechecked against the specified Profile. 


  • Designer Awareness: Q-Checker anticipates and captures requirements of all downstream applications, even where they may not be evident to the designer. When operated already from the early beginning in the design process, Q-Checker will support and enhance cross-engineering as well as model reuse. The key to a successful implementation is the integration and adaptation to companies PLM processes. 

Q-Checker: Interactive checking of CAD Data 

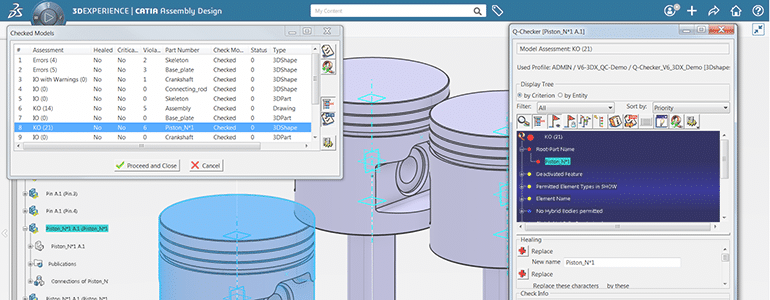
Q-checker interactively checks the CAD designs i.e. parts, drawings, assemblies right in CATIA workbench and qualify immediately if the data meets the quality requirements as per company CAD standard or as mentioned in Q-checker profile. Q-checker can be run in a batch mode. There are more than 400 Data Quality checks already in-place in shipped licenses of Q-checker out of that 200+ checks have auto-healing function. Auto-healing function of Q-checker resolve the CAD concerns right automatically.

Figure 3: Q-Checker Interactive check user interface.


Q-Checker: Check Profile Creation 

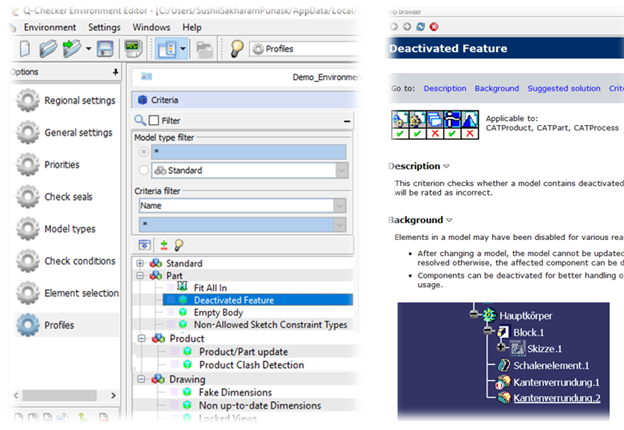
In any organisation, there can be many departments that have varying needs from the CAD designs. e.g. CAE team requires material specs, thickness, fixing locations etc, electrical team might not need these. So, Q-checker facilitates creating Check profiles individually for various departments in a organisation. Figure 4 showcases how to create check profiles in Q-checker and save according to the department name e.g. Electrical profile, Chassis profile, interior trims profile etc. 

Fig 4: Q-Checker Profile creation UI. 

We’ll discuss in detail some of the standard checks in the upcoming series. 

Subscribe to our newsletter

Get all the latest information on Events, Sales and Offers.