Which Licenses Are Really Being Used? Deep Dive into DSLS Utilization Metrics

Engineering and design organizations invest heavily in Dassault Systemes software — including CATIA, ENOVIA, SIMULIA, DELMIA, and 3DEXPERIENCE platform roles. However, despite the scale of this investment, many teams struggle to answer one critical operational question:

“Are we truly utilizing our licenses efficiently?”

Understanding who is using what license, when, and how often can significantly reduce renewal costs, eliminate bottlenecks, and support strategic planning. This blog will guide you through monitoring and analyzing Dassault Systemes License Server (DSLS) utilization data — across hourly, daily, and monthly timeframes — to help you optimize license usage and make informed decisions.


Why License Utilization Tracking Is Essential

Monitoring and analyzing DS License Server utilization offers multiple organizational benefits:

  • Prevent license shortages during peak working hours
  • Identify unused or rarely used licenses and avoid overprovisioning
  • Support renewal decisions with actual usage data
  • Enable proactive capacity planning
  • Reduce idle check-outs and improve availability
  • Ensure compliance with Dassault Systemes licensing terms

Key Metrics to Track

For accurate insights, organizations should measure:

  • License Type Utilization

Track usage per module or role, rather than just total consumption.

Examples:

License Feature  Module Type Status
MD2 CATIA Mechanical Design High usage
AME Assembly & Manufacturing Moderate
SIMULIA Abaqus Simulation Seasonal peaks


  • Time-Based Usage Trends

Understanding temporal license usage helps identify patterns and bottlenecks.

Metric Purpose
Monthly Trends Budgeting & renewal planning
Daily Variations Identify peak working days
Hourly Patterns Detect rush hours & underutilized time windows


  • User-Based Tracking

Monitoring at user level helps identify:

  • Heavy consumers
  • Idle seat holders
  • License hoarding behaviors

Useful for internal audits and reallocation.

  • Available vs. Utilized Capacity

Compare:

Metric Meaning
Total Purchased Licenses Your entitlement
Current Usage Active checked-out seats
Peak Usage Maximum concurrent usage
Idle % Unused capacity ratio

How to Monitor License Utilization in DSLS

Dassault Systemes provides both GUI and CLI-based tools to visualize and extract usage data.

Option 1: Using the DS License Administration Tool (GUI)

Steps:

  • Open:
    • Windows: Start → Dassault Systemes → License Administration
    • Linux:
    • /usr/DassaultSystemes/DSLS/linux_a64/code/bin/DSLicSrv (path may vary)
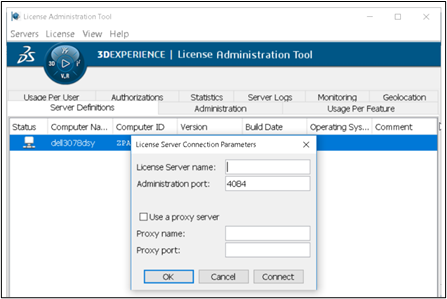
  • Connect to the license server using its hostname/IP and default port (4085 unless modified).
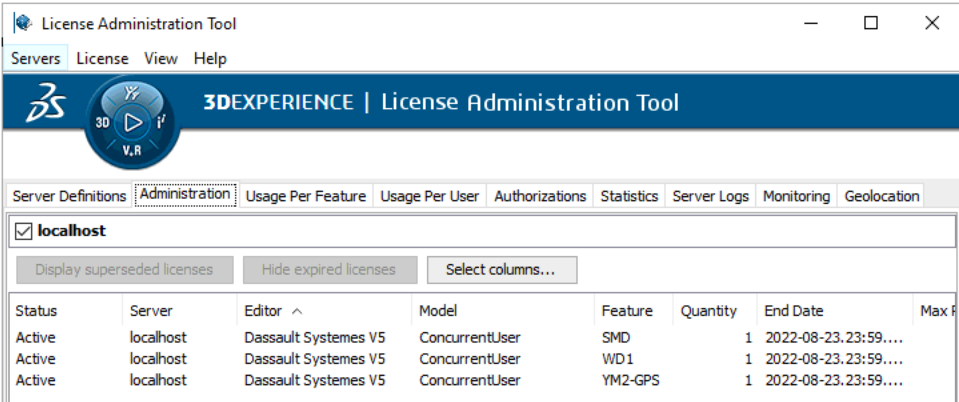
  • Navigate to the License Usage tab to view:
    • Feature name
    • Number of seats in use
    • Active users
    • Check-out duration

GUI primarily shows real-time usage only, not historical trends.

Option 2: Using the lic-admin CLI Tool

Common Commands:

Command Purpose
licadmin -usage -all View all active license sessions
licadmin -available Display remaining vs total licenses
licadmin -status Check server health & uptime

These commands can be scripted and scheduled for automation.

Option 3: Historical Log Parsing (Recommended)

DSLS maintains logs at:

  • Windows: C:\ProgramData\DassaultSystemes\DSLS\logs\
  • Linux: /var/DSLS/log/DSLicSrv.log

A script (Python/PowerShell) can extract:

  • Username
  • Feature name
  • Checkout time
  • Check-in time
  • Host machine

Generating CSV, Excel, Heatmaps, and Dashboard Visuals provides deep insight.


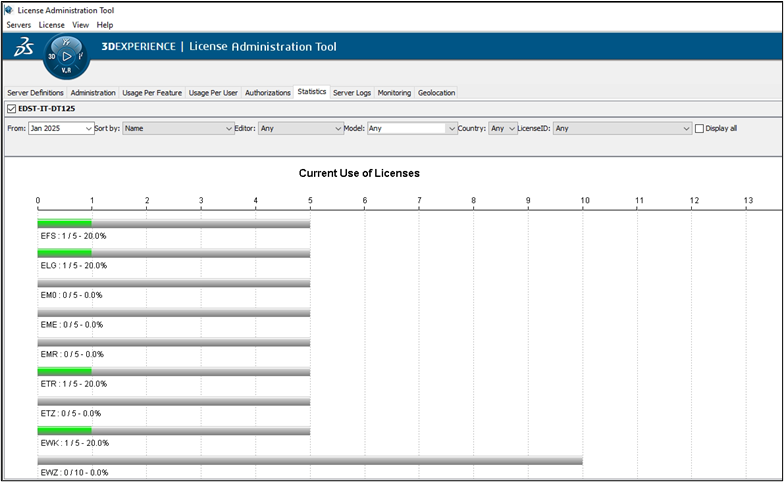
Sample Utilization Dashboard (Visualization Proposal)

License Type Total Seats Peak Usage Least Used Hour Usage Score Action
CATIA MD2 10 9 (Mon 10AM) Weekends ★★★★★ Retain
SIMULIA ABAQUS 5 5 (Wed 2PM) Early morning ★★★★☆ Add 1 or optimize
ENOVIA 8 3 Evenings ★★☆☆☆ Reduce or reassign

(Insert chart visualization: heatmap or trend line)


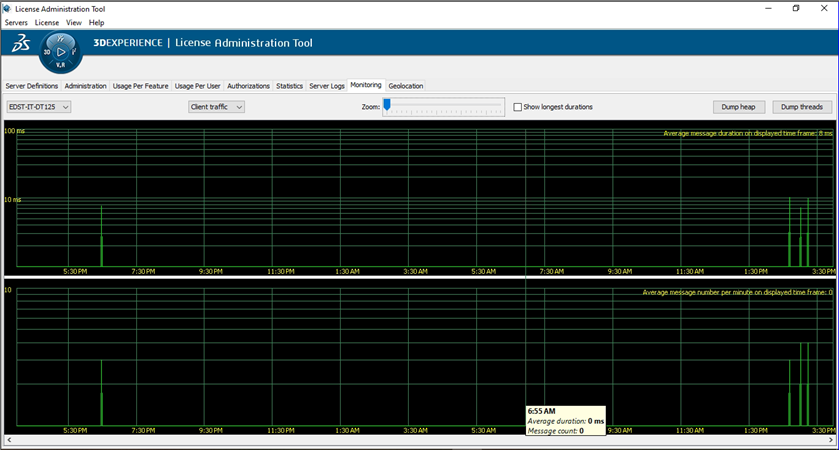
For Monitoring of license usage 

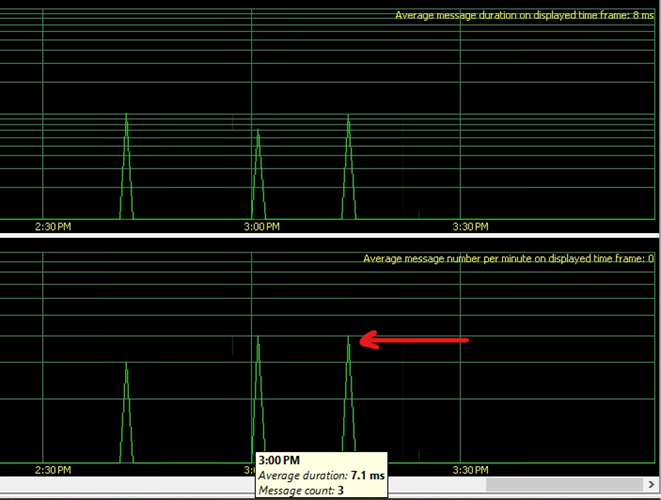
The Monitoring tab provides real-time and historical information about license activity: who is using a license, when they checked it out, denial events, borrow history, and server health.

It typically contains several sub-sections:

Shows events where a user attempted to check out a license but none were available, license server activity and Borrowed licenses for usage tracking


Details of licenses used per timing


Advanced Enhancements

  • Automation & Scheduling
    • Schedule hourly DSLS CLI exports
    • Auto-email reports via scripts
    • Integrate with Power BI, Tableau, Excel Power Query
  • Governance Best Practices
    • Idle session timeout policy
    • License borrowing policy
    • User education on returning licenses

KPIs to Measure

KPI Target Example
Peak Usage % >80%
Idle License % <20%
Concurrent Usage Growth Year-over-year trend
License Borrowing Compliance 100%

Recommendations

After analyzing usage:

  • Reduce under-used licenses
  • Reallocate expensive roles to critical users
  • Enable “auto return” to prevent hoarding
  • Optimize workloads (simulation batch runs during low usage hours)

Final Thoughts

Strategic license management is not only about cost optimization — it is about ensuring productivity, availability, and scalability across engineering teams. With structured tracking, reporting, and optimization, Dassault Systèmes customers can ensure:

  • Better utilization
  • Data-driven renewals
  • Faster workflows
  • Improved user experience

When you measure usage — you gain control. When you optimize usage — you gain value.

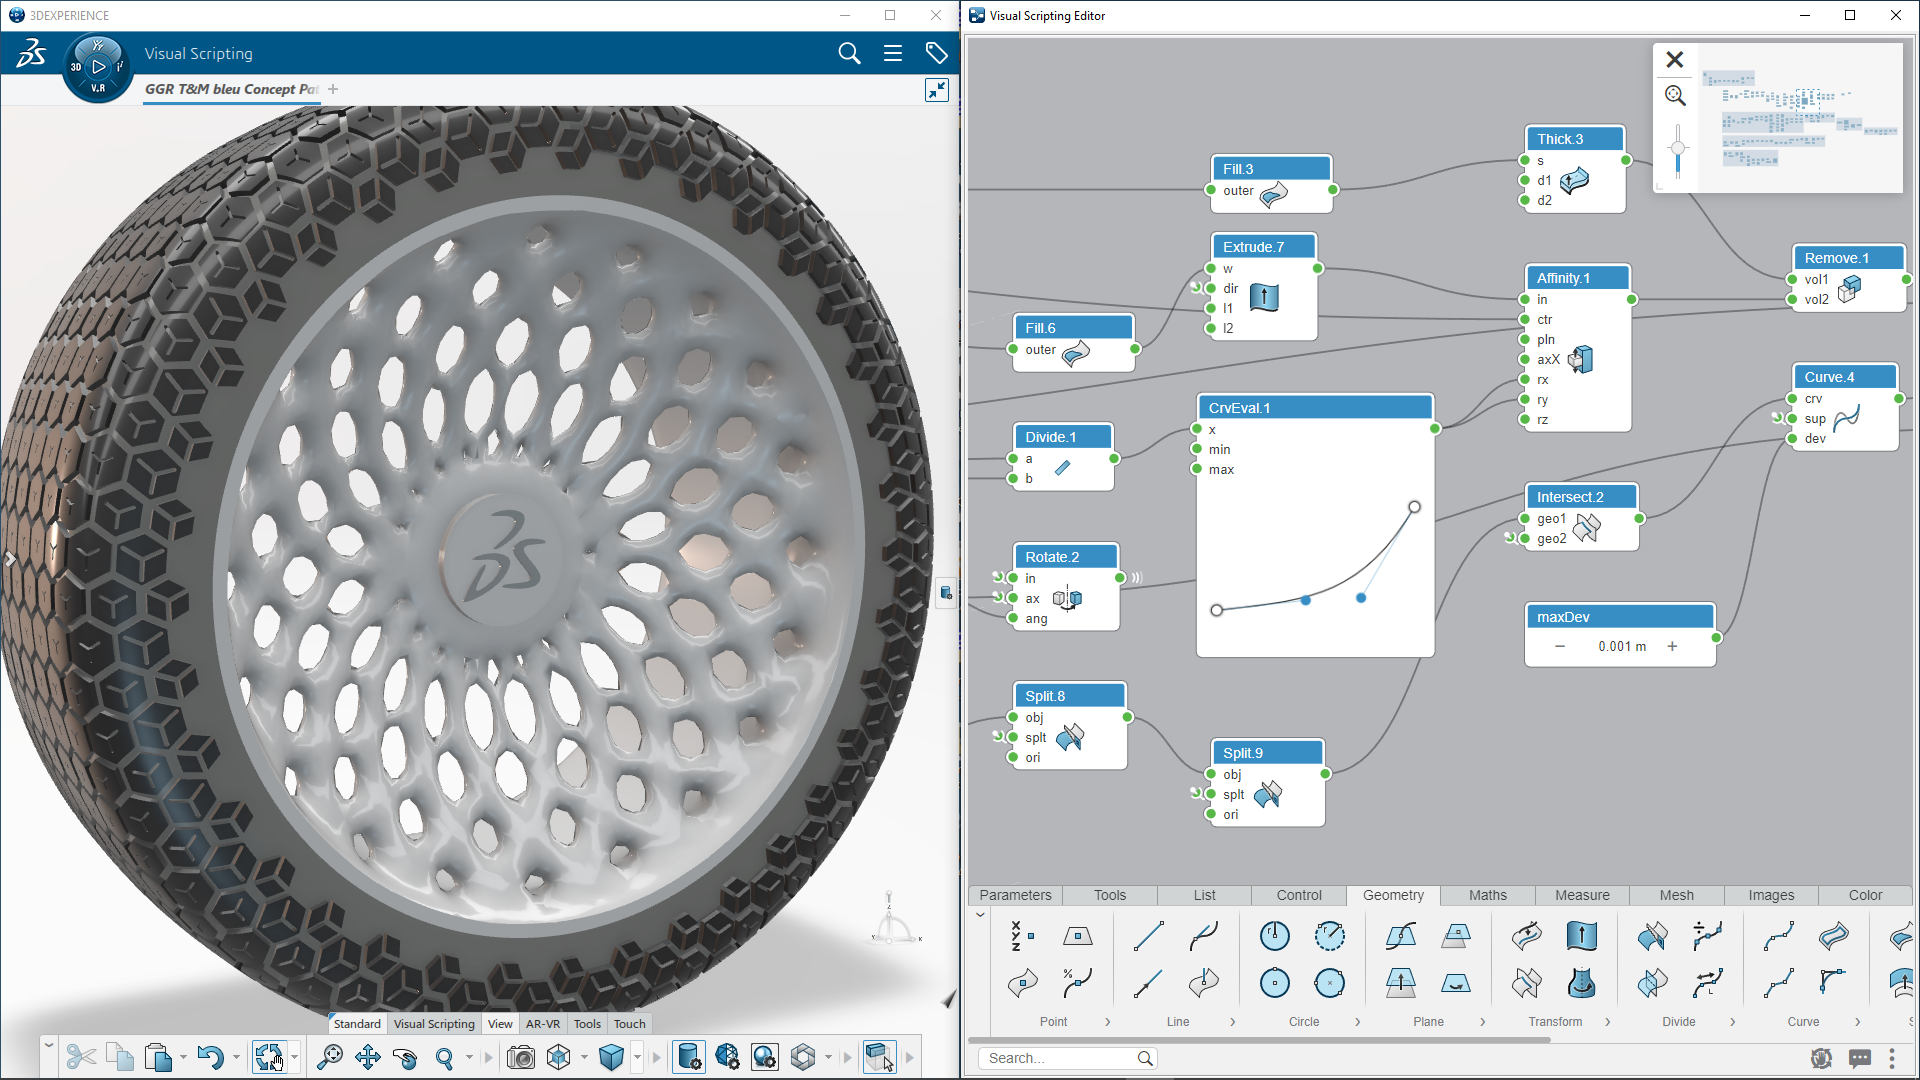
CATIA Design with Visual Scripting for Innovation and Optimizing Engineering Processes

In the evolving world of digital engineering, efficiency and innovation are the key drivers of competitive advantage. As product complexity increases, engineers and designers need intelligent tools that not only simplify modeling but also automate repetitive tasks and enable creative exploration. CATIA Design with Visual Scripting on the 3DEXPERIENCE platform brings this capability to life by combining the power of parametric modeling with the flexibility of graphical programming, revolutionizing how engineering processes are conceived and executed.

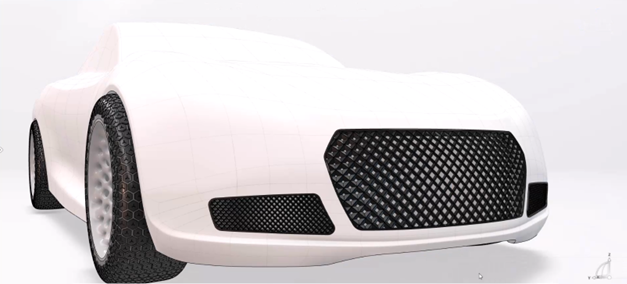
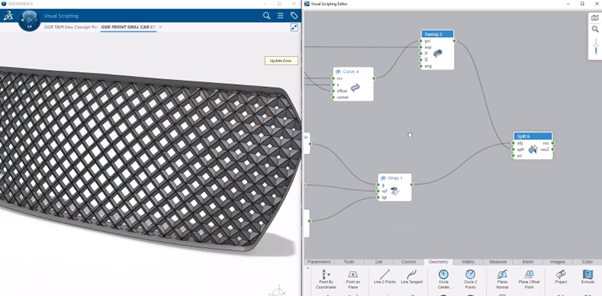
Visual Scripting in CATIA introduces a dynamic, node-based approach to automation and design optimization. Instead of writing traditional code, engineers can create logic flows by connecting visual blocks that represent operations, conditions, and parameters. This makes automation accessible to both technical and non-programming users while maintaining the robustness and precision of CATIA’s modeling engine. Through this visual interface, users can define complex design rules, automate geometry creation, control configurations, and drive intelligent updates — all without needing to switch between programming environments or manual design workflows.


Within the 3DEXPERIENCE environment, Visual Scripting seamlessly integrates with CATIA applications, allowing users to directly interact with geometry, product structures, and parameters in real time. Designers can manipulate inputs, visualize outcomes instantly, and optimize designs through iterative logic testing. This integration enables a rule-based and knowledge-driven design approach, reducing dependency on manual operations while ensuring consistency across design iterations. Moreover, because the entire workflow exists within a unified data model, teams benefit from full traceability and collaboration, ensuring that changes made by one designer are instantly reflected across the project.

The power of Visual Scripting extends far beyond automation — it serves as an enabler for design innovation and optimization. Engineers can use scripting to explore design variations rapidly, conduct parameter sweeps, and perform what-if analyses that would otherwise take hours to model manually. It also helps standardize company-specific best practices, ensuring that every project adheres to design rules, material usage standards, and manufacturability constraints. Whether it’s automating fixture design, optimizing surface layouts, or streamlining complex assembly creation, Visual Scripting accelerates productivity and reduces the potential for human error.

From a broader perspective, CATIA Visual Scripting Designer bridges the gap between design automation and artificial intelligence. By connecting data from simulation, manufacturing, and product lifecycle applications, it fosters a model-based engineering ecosystem that enhances decision-making and reduces iteration cycles. The result is a smarter, more agile product development process that aligns creativity with efficiency.


In conclusion, CATIA Design and Visual Scripting empower engineers to innovate faster and design smarter by blending automation, logic, and creativity into a single workflow. It transforms the traditional CAD environment into an intelligent design ecosystem that adapts to user intent, accelerates product development, and ensures design excellence. As industries continue to embrace digital transformation, Visual Scripting stands as a cornerstone of engineering innovation and process optimization within the 3DEXPERIENCE platform.

How to Change the Background Colour of Drafting in 3DEXPERIENCE

In Dassault Systèmes 3DEXPERIENCE platform, engineers often prefer to personalize their environment for better visibility and comfort — especially in the Drafting App. One common customization is changing the background colour of drafting sheets.

By default, 3DEXPERIENCE uses a standard drafting template controlled by system environment variables and XML standard files. In this guide, we’ll walk through how to change the drafting background colour by modifying the default standard files and CATENV configuration — all while keeping your company’s settings organized and reusable.


Step 1: Copy Default Drafting Standards

  • Navigate to the default installation directory:
  • C:\Program Files\Dassault Systèmes\B427_Cloud\win_b64\resources

(Note: The folder name (like B427_Cloud) might vary depending on your 3DEXPERIENCE version or deployment type)

  • Locate the folder named standard inside the resources directory.
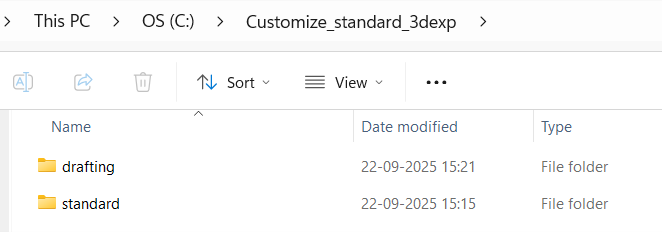
  • Copy the entire “standard” folder and paste it into a new directory where you will store your custom standards.

Example: C:\Customize_standard_3dexp\standard

  • You can rename the folder or path based on your company’s configuration structure.


Step 2: Locate and Edit the CATENV File

The CATENV file defines environment variables and paths for 3DEXPERIENCE. Updating this file ensures your custom standards are recognized.

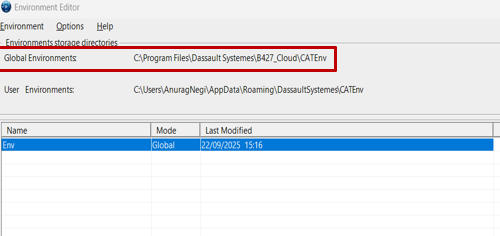
  • Open Environment Editor from the Windows Search bar
  • Locate the Global Environments section.
  • Identify where the CATENV file is stored, typically under:

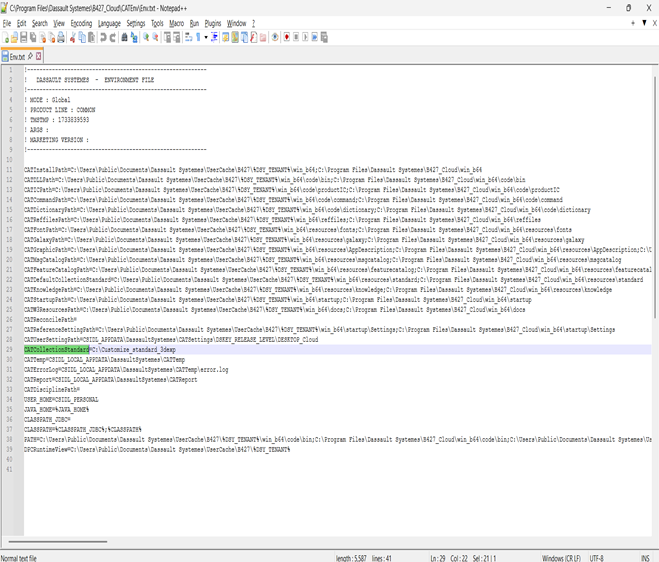
C:\Program Files\Dassault Systemes\B427_Cloud\CATEnv

  • Open the CATENV file using Notepad++ or any text editor.
  • Find the line that specifies CATCollectionStandard (usually around line 29).
  • Add your custom standards folder path after the “=” sign.

Example: CATCollectionStandard=C:\Customize_standard_3dexp\standard

  • Save and close the file

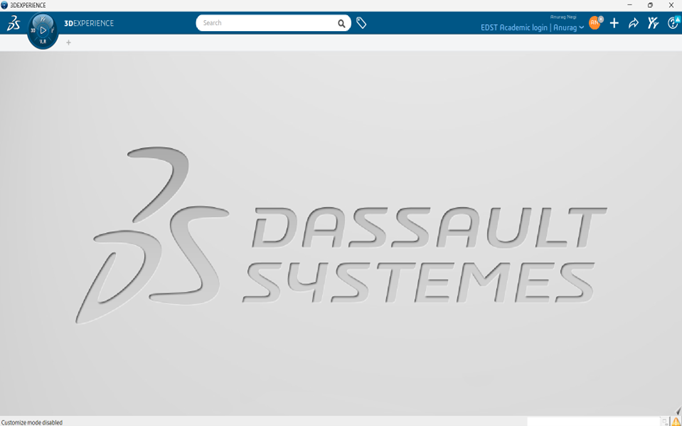
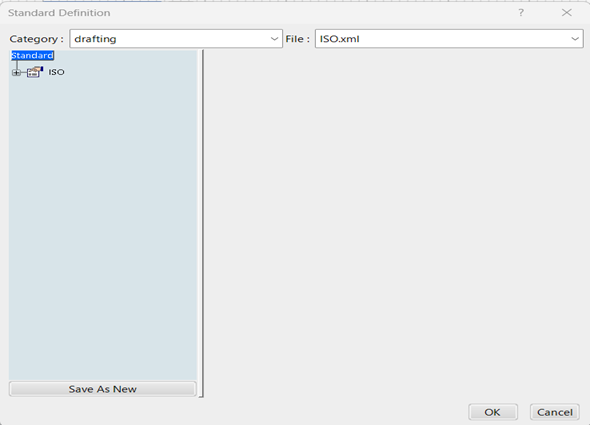
Step 3: Open 3DEXPERIENCE and Configure Drafting Standards

  1. Launch 3DEXPERIENCE and open any application.
  2. Close it immediately — this ensures environment paths refresh.
  3. It should be like below image


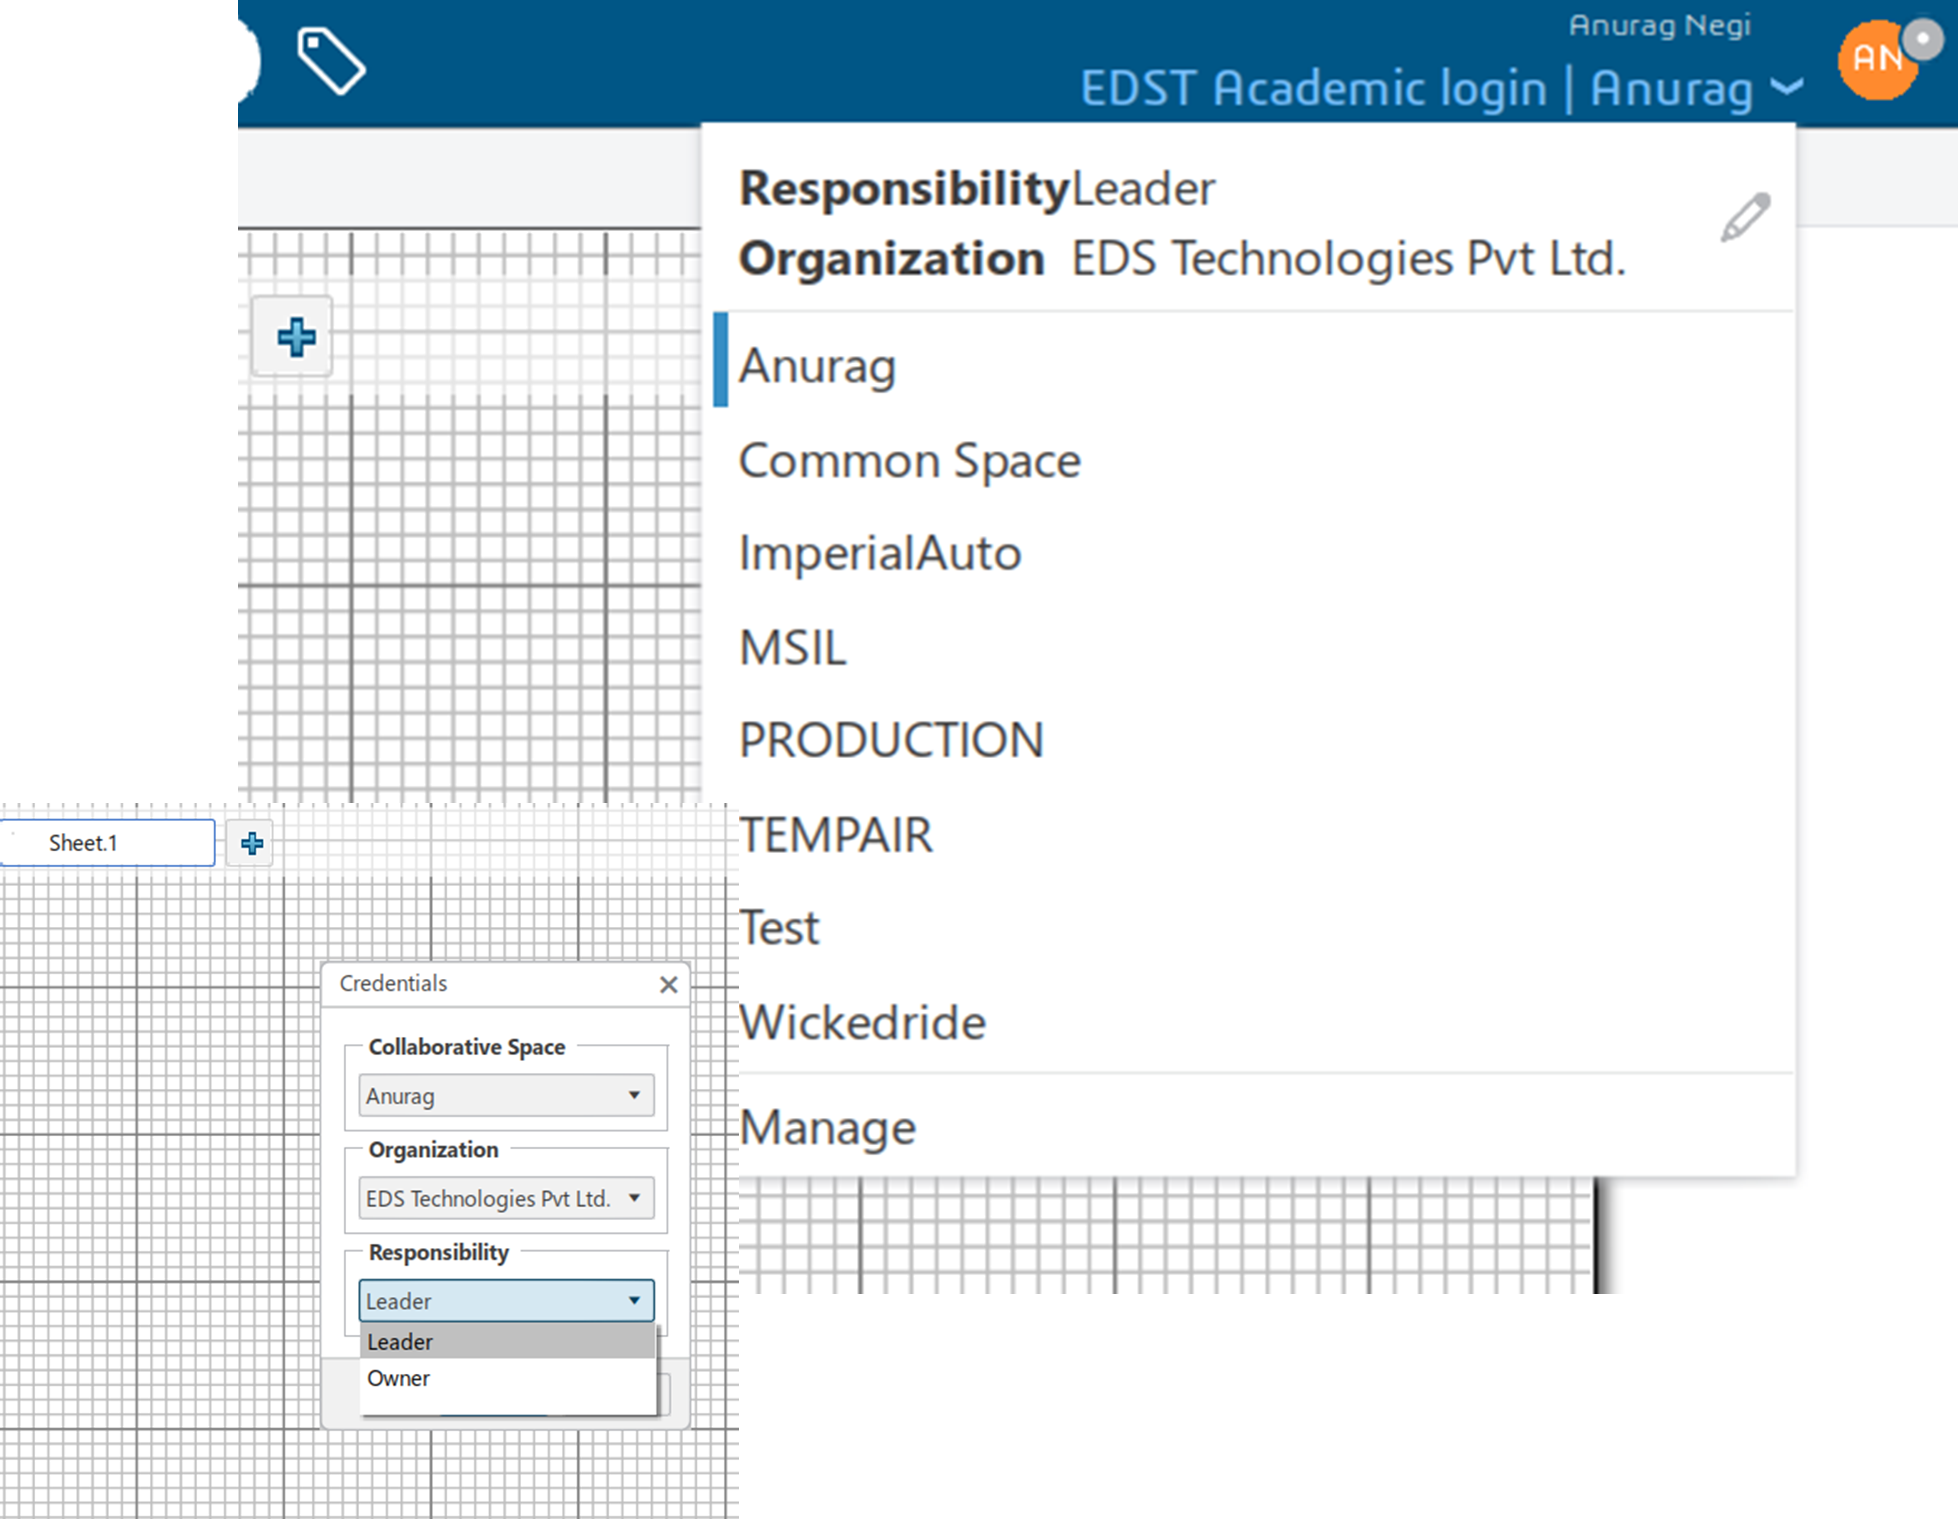
Step 4: Set Responsibility to “Owner”

  • Click the downward arrow next to your username.
  • Select EditResponsibility tab → change to Owner
  • Confirm the change.

(This step ensures you have permission to modify and save custom standards.)


Step 5: Customize and Save Drafting Standard

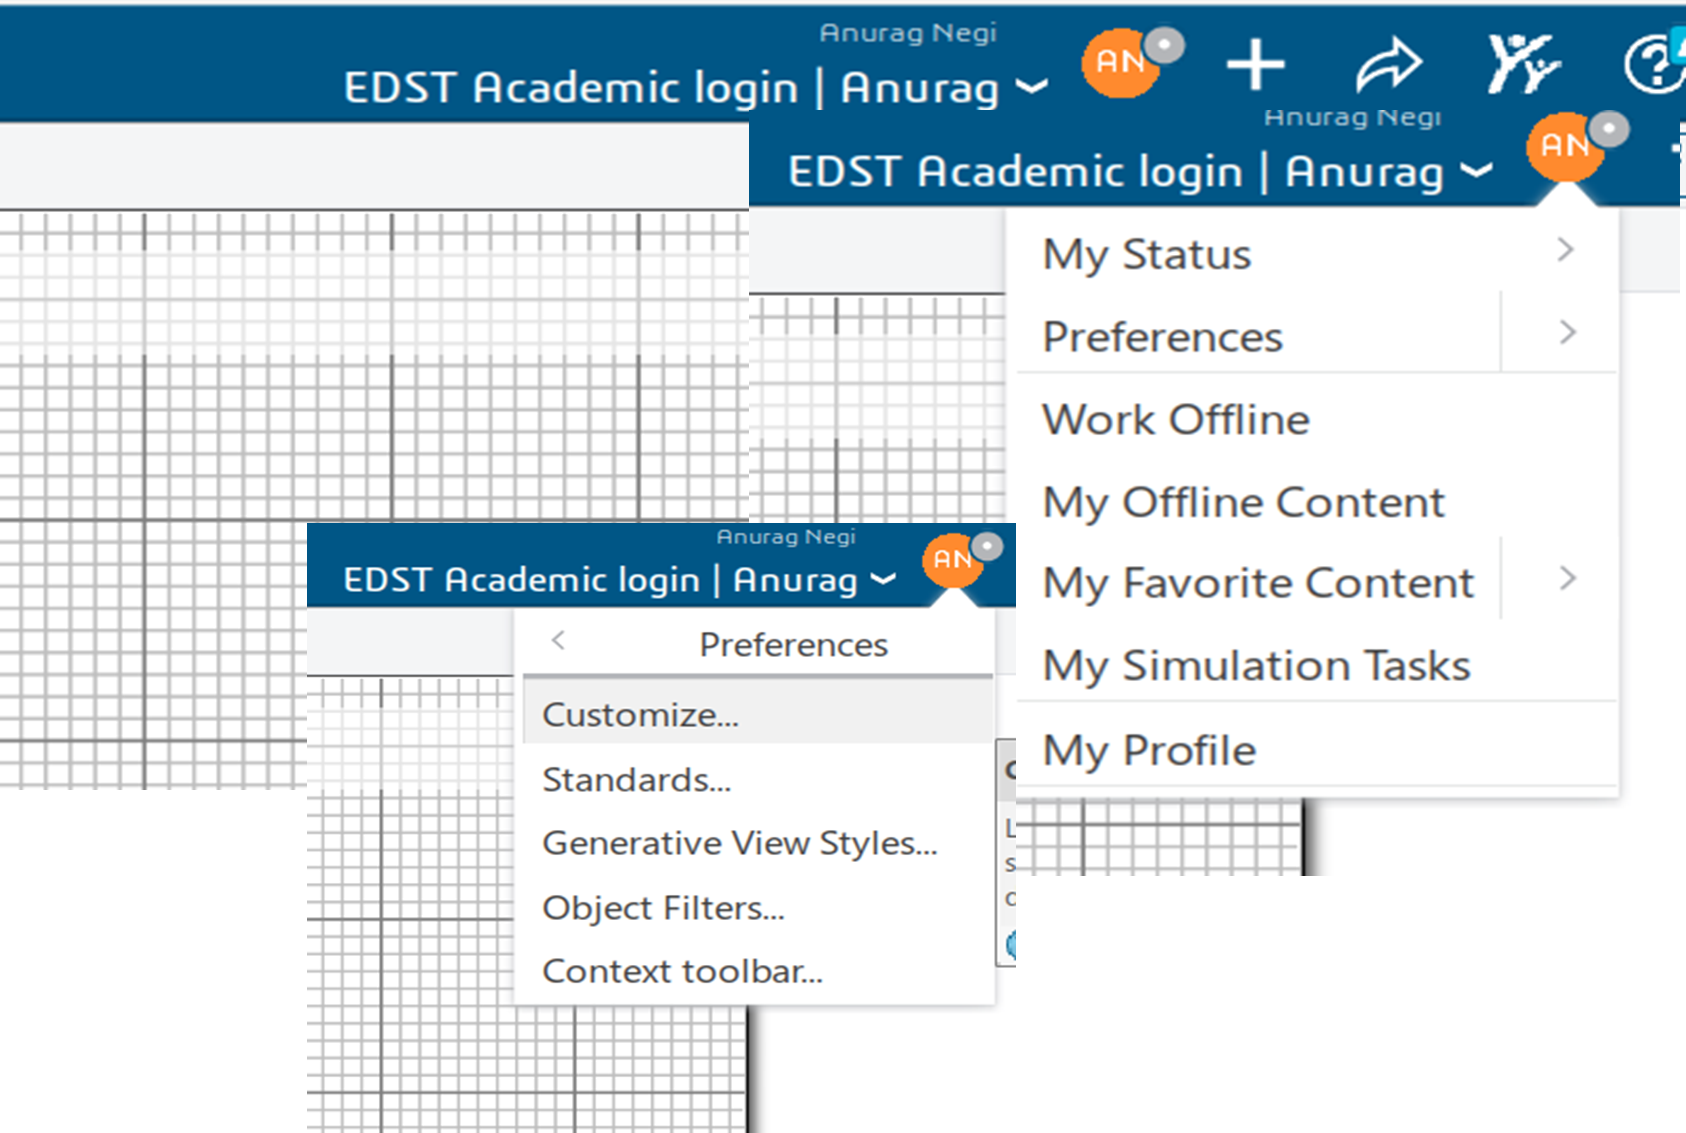
  • In the App, click the “Me” symbol (beside your name).
  • Go to Preferences → Standards.
  • In the dialog box:
    • Set Category to “Drafting”.
    • Select the desired XML file (e.g., ISO.xml or ASME.xml).
    • Click Save As New and provide a new file name.
    • Save the file in your custom location:
    • C:\Customize_standard_3dexp\standard\drafting


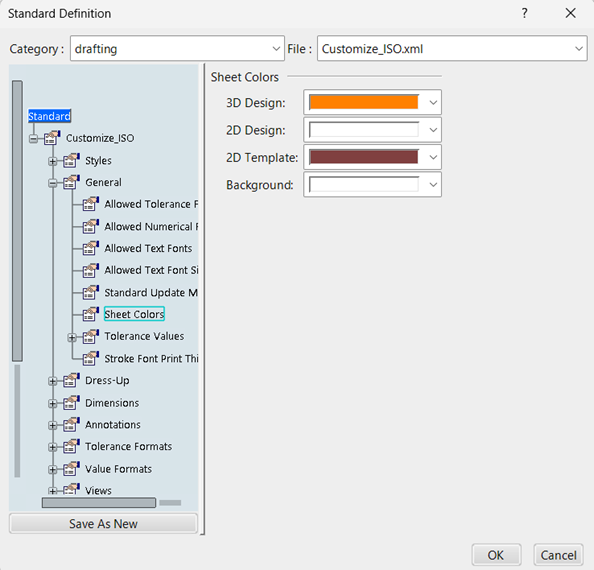
Step 6: Change Background Colour

Now that your custom standard is ready:

  • Navigate to:
    Standard → General → Sheet → Colors → 2D Template.
  • Choose your preferred background color.
  • Click OK to save.
  • Change the Responsibility back to Leader once completed.

You can now open any drawing to verify that the background color has successfully updated according to your preference.


Summary of Key Paths

Purpose Path
Default Standards C:\Program Files\Dassault Systemes\B427_Cloud\win_b64\resources\standard
Custom Standards C:\Customize_standard_3dexp\standard
CATENV File C:\Program Files\Dassault Systemes\B427_Cloud\CATEnv

Tips & Best Practices

  • Always backup the default standard before making modifications.
  • Keep a naming convention for your customized standards (e.g., ISO_Custom.xml).
  • Use version control if multiple engineers edit standards.
  • For large organizations, centralize the custom standard path to ensure consistency.

Conclusion

Changing the drafting background color in 3DEXPERIENCE isn’t just about aesthetics — it’s about improving readability, consistency, and user comfort. By following this guide, you can easily manage and customize your drafting environment using controlled standards and CATENV configurations.

Automatic Design: Precision Optimization for Peak Imaging System Performance

Design for any imaging system starts with a set of requirements such as focal length, field of view, image size and resolution. Selecting the appropriate first-order layout from the design library or sample lenses, closest to the specification is beneficial, yet it is often the simplest aspect of the design process. The initial design is plagued with various spherical and chromatic aberrations that degrade image quality and fails to account for any physical limitations or manufacturing tolerances. It is necessary to find a balance between meeting performance requirements and staying within budget. The primary challenge is to overcome the inherent trade-offs between these goals to achieve an optimal design that can be effectively implemented when coupled with physical constraints and manufacturing cost.

The anatomy of a lens is defined by how precisely the design is rectified to eliminate its intrinsic imperfections. The traditional method of correcting these flaws, a manual process of trial and error is extremely time consuming. Manipulation of several variables simultaneously, such as the curvature, thickness, or material of the lens, leads to the realization that correcting one aberration worsens another. This necessitates an endless cycle of design iterations which ultimately stagnates the product development cycle.


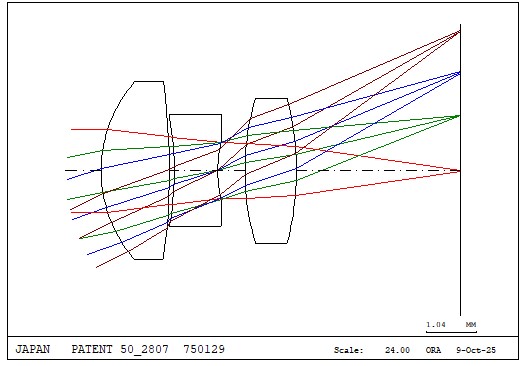
Fig. 1: Initial lens design in CODE V with both 2D and 3D views
 

Leveraging CODE V’s powerful optimization tool helps automate the task of finding the best design. This computational process combines image error data into a single value called the error function, that we attempt to make as small as possible. This thorough, iterative approach yields an imaging system that generates clear and distortion-free images. In addition to enhancing performance, it also improves overall efficiency and robustness.

Optimization: Paradigm Shift Towards Automation and Precision

CODE V’s optimization feature called Automatic Design (AUT) uses damped least square algorithm (DLS) to generate changes in variables that improve the system. Constraints defined based on physical dimension, material availability and manufacturing conditions act as boundaries when identifying the ideal solution.

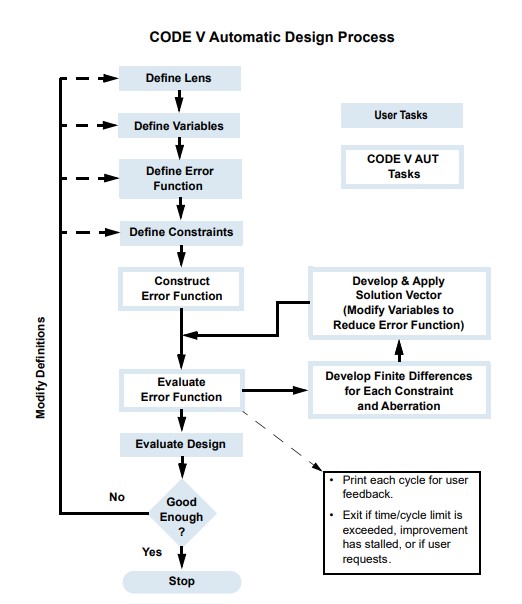
Optimization Workflow in CODE V

  1. Define as variables all radii of curvatures, thickness values, and fictitious glasses in lens data manager (LDM).
  2. Make sure all glass elements are thick enough and glass index is not too high to ensure design is cost effective.
  3. Set specific constraints on parameters that shouldn’t be varied by the optimization process like, effective focal length (EFL), FOV, dimension or glass materials.
  4. Specify user defined error function or use the default spot size error function in CODE V.
  5. Draw the lens on each optimization cycle and analyze its modulation transfer function (MTF), point spread function (PSF) and various field aberration curves.
  6. Additionally, cost analysis evaluates the glass cost and blocking factors which helps compare relative costs of various design.
  7. Ghost and Narcissus image analysis (GHO, NAR) are paraxially based options for evaluating unwanted secondary images.


Fig.2: Depicts the optimization workflow in CODE V
 

Optimization tool is a necessity for modern optical design. It significantly reduces the time it takes to produce a manufacturable design thus enhancing efficiency. Drastically improves device performance and image quality due to its capability of simultaneously varying multiple parameters which is never possible manually. It helps ensure higher yield and lower costs by accounting for design sensitivity towards manufacturing.

In essence, optimization transforms the design process from a labor-intensive, trial-and-error approach into a data-driven, systematic search for the best possible solution.

Maximize Your 3DEXPERIENCE Usage: 5 Powerful Features to Try Today

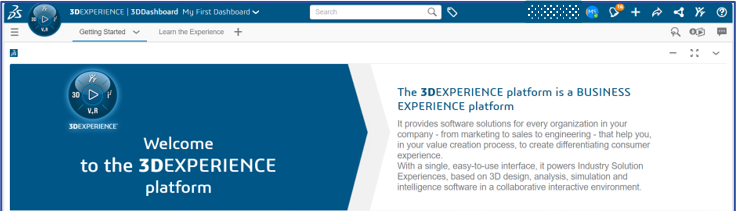
The 3DEXPERIENCE platform by Dassault Systèmes is packed with powerful tools that help teams design, collaborate, simulate, and manage products more efficiently. While many users are familiar with the basic functions, there are several lesser-known features that can significantly improve productivity and collaboration – if you know where to look.

In this blog, we shall explore the top 5 features in 3DEXPERIENCE you might not be using – but should! Whether you’re an Engineer, Designer, Manager, or Project Coordinator, these tools can make your workflows faster, smarter, and more connected.


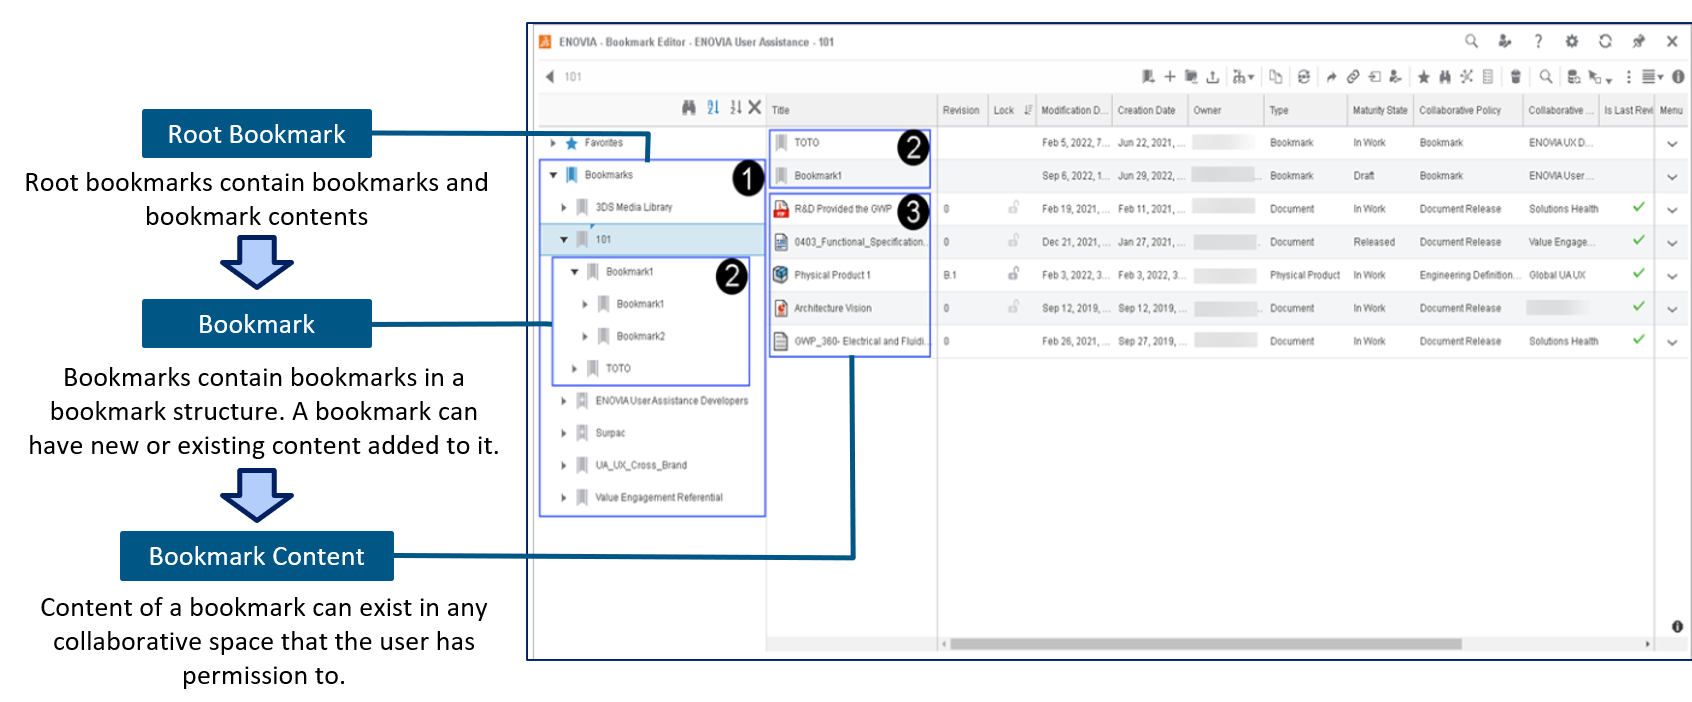
Bookmark Editor – Organize Your Data Like A Pro

Think of the Bookmark Editor as your personal project organizer within 3DEXPERIENCE. It helps you sort and manage your files, designs, and documents across different company projects – all in one place.

Why use it?
Instead of digging through folders or searching for file names, you can create bookmarks for quick access. It is perfect for managing product versions, project milestones, or different stages of development.

One of the useful tips is to use bookmarks to group project files and share them easily with your team – no more confusion about “latest versions.”


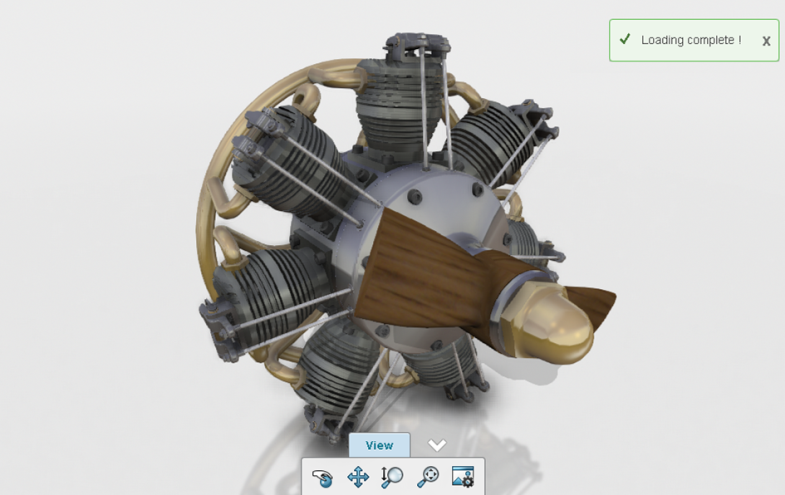
3DPlay – View and Share 3D Models Without CAD Software

With 3DPlay, you don’t need full CAD software to view, rotate, or inspect 3D models. It is a lightweight tool built into the platform that runs directly in your browser.

Why use it?
It allows stakeholders – including non-engineers – to interact with 3D models in real-time, without needing special software.

You can use 3DPlay to show designs to customers, management, or suppliers. It is a great way to communicate ideas visually.


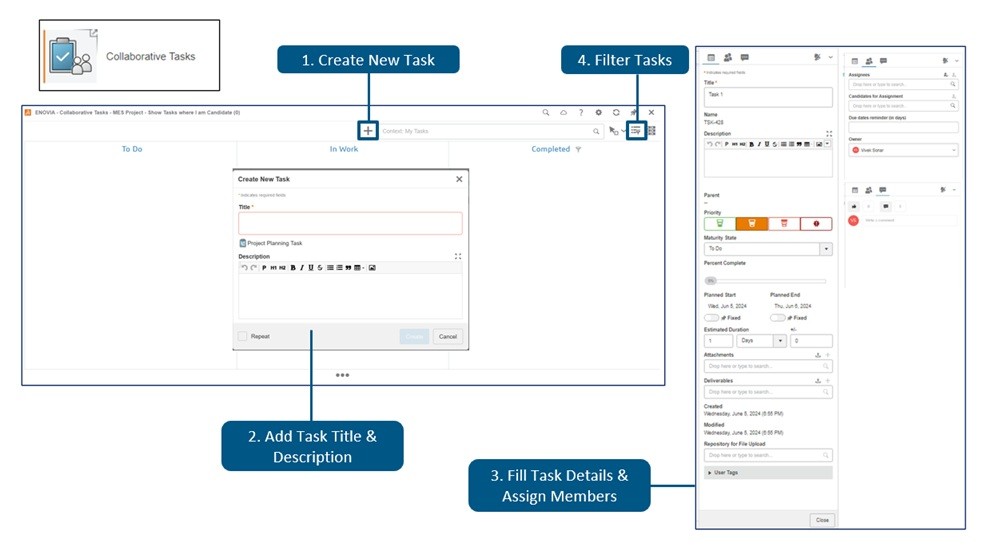
Collaborative Tasks – Manage Work Visually

Forget sticky notes and disconnected task lists. The Collaborative Tasks app gives you a visual, drag-and-drop board to manage project work. It is like a digital Kanban board built right into 3DEXPERIENCE.

Why use it?
You can assign tasks, set deadlines, track progress, and attach files – all within your product development environment. You can create task boards for design reviews, approvals, or even daily team stand-ups.


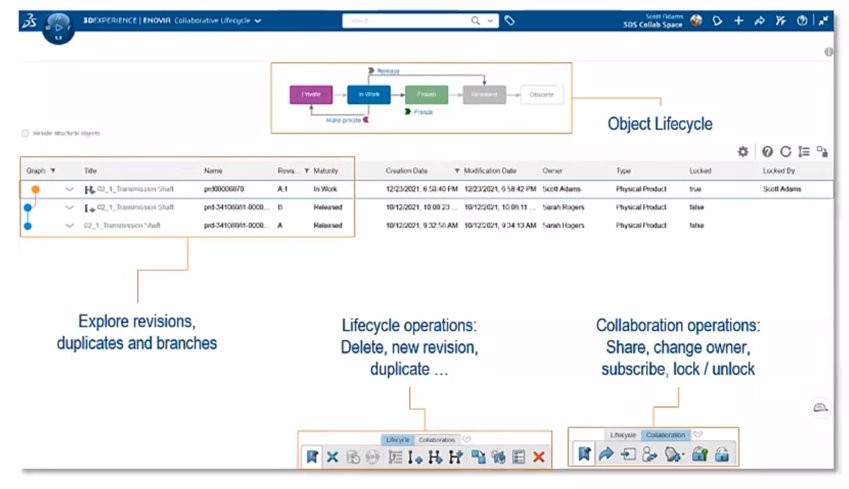
Lifecycle Management – Control Your Product Data

One of the most powerful features of 3DEXPERIENCE is its built-in lifecycle management tools. They help you control who can see, edit, or approve your files at different stages – from concept to production.

Why use it?
You can lock designs, manage revisions, and control approvals – reducing the risk of errors and miscommunication. You can set up lifecycles for parts and assemblies to ensure that changes are reviewed and documented before they go live.


3DSwym – Collaborate Like a Social Network for Engineers

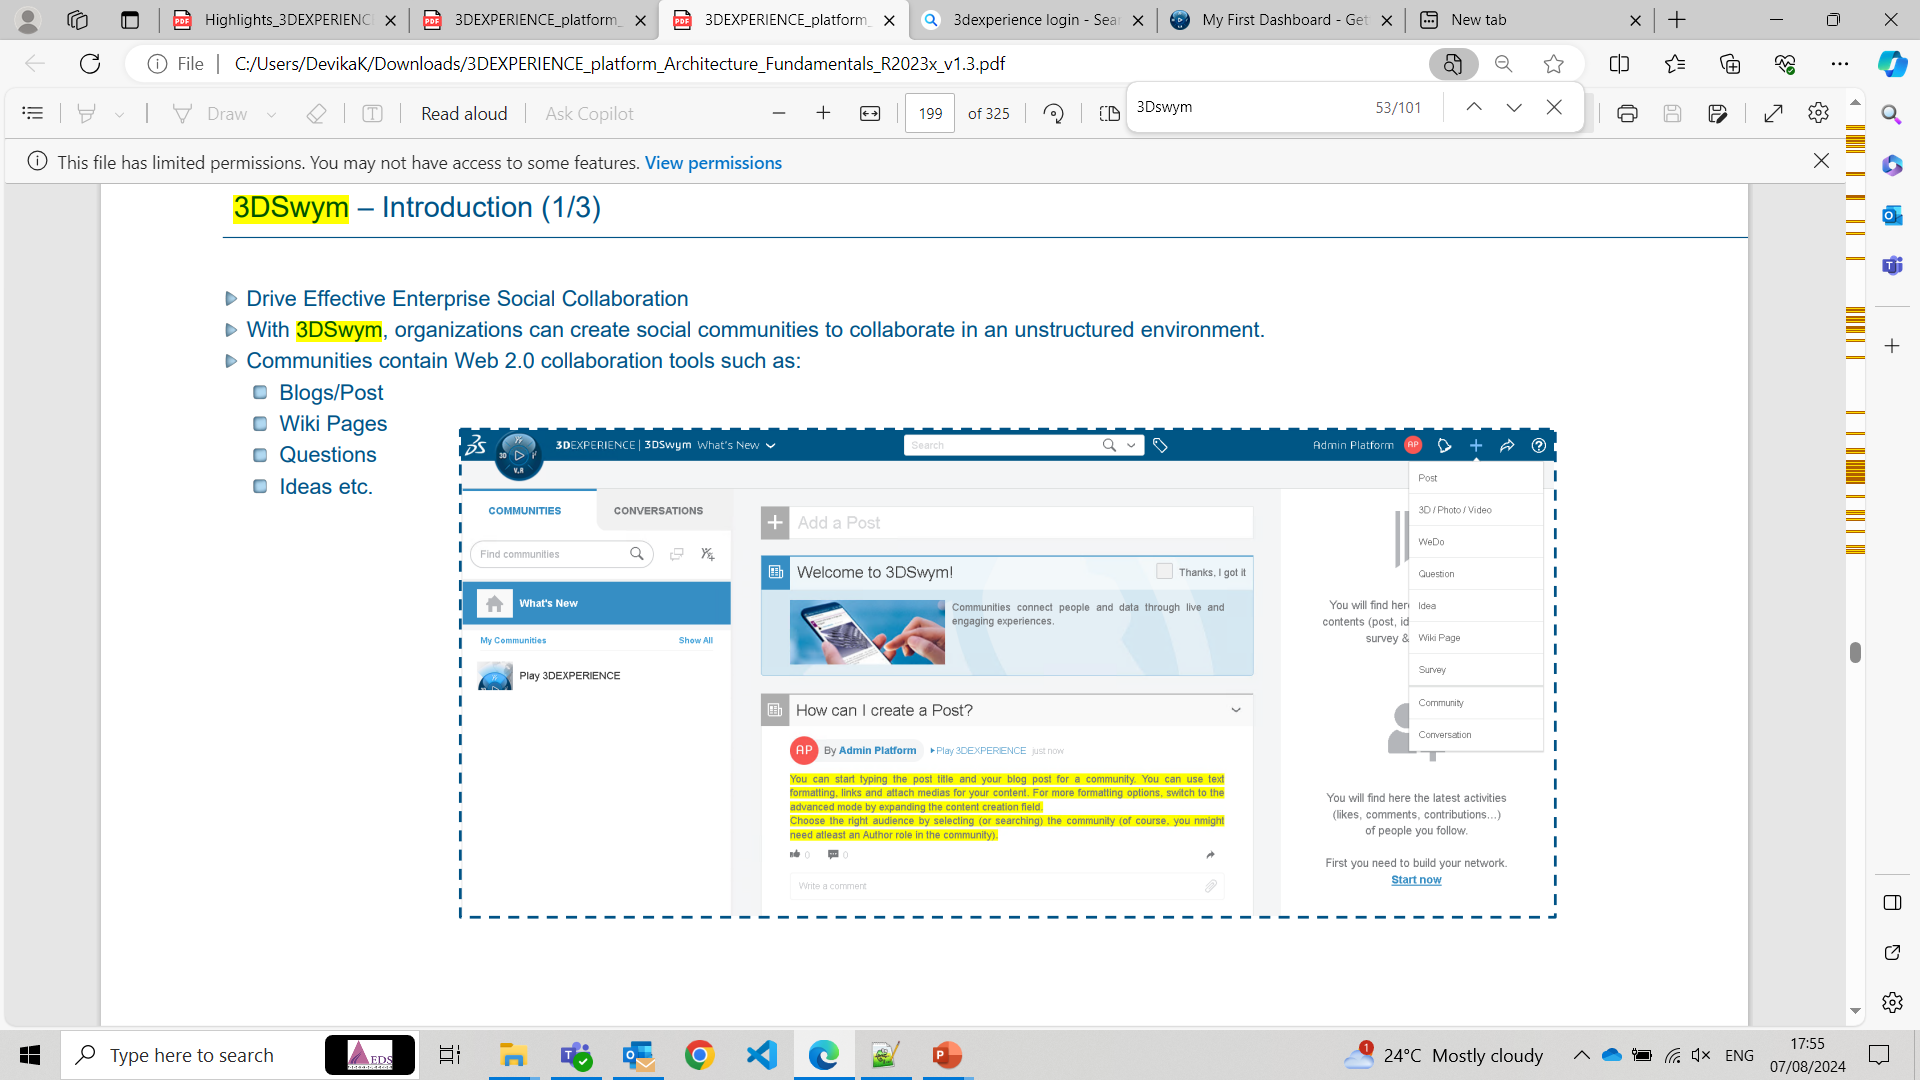
3DSwym brings a social-media-like experience to your engineering projects. It allows teams to post updates, ask questions, share ideas, and discuss challenges – all within the platform.

Why use it?
It improves communication across departments, especially for remote or cross-functional teams. You can create a 3DSwym community for each project or product line. It keeps conversations, ideas, and documents all in one place.


Conclusion

The 3DEXPERIENCE platform is much more than just a place to store CAD files – it is a complete ecosystem for collaboration, innovation, and efficient product development. By taking advantage of features like Bookmark Editor, 3DPlay, Collaborative Tasks, Lifecycle Management, and 3DSwym, your team can work smarter, stay better organized, and move faster from idea to execution.

Optimizing Manufacturing with DELMIA Factory Flow Simulation

Optimizing factory layouts, workflows, and material movement is essential for increasing productivity and cutting expenses in the fast-paced manufacturing sector of today. Manufacturers can digitally model, analyze, and optimize their manufacturing operations with Dassault Systèmes’ sophisticated DELMIA manufacturing Flow Simulation system. Before making tangible changes, companies can find inefficiencies, cut waste, and boost productivity by modelling manufacturing flows.

Efficiency and cost reduction are critical in the highly competitive manufacturing environment of today. Conventional production planning techniques can result in unforeseen bottlenecks, inefficiencies, and expensive operating expenses. Dassault Systèmes’ state-of-the-art DELMIA Factory Flow Simulation transforms production by offering a digital twin of factory activities.

Before adjusting in the real world, producers may use this potent tool to visualize, analyze, and optimize workforce dynamics, machine interactions, and material flow. Businesses may proactively detect inefficiencies, optimize production processes, and boost overall productivity by utilizing virtual simulation, which results in more intelligent, data-driven decision-making.


DELMIA Factory Flow Simulation: What is it?

DELMIA Factory Flow Simulation enables businesses to model and examine worker dynamics, machine interactions, and material flow in a digital twin of their plant. Without interfering with real production lines, this application offers insights into resource usage, process optimization, and logistics constraints.


DELMIA Factory Flow Simulation’s Salient Features

Modelling a virtual factory

  • Make a digital replica of the factory setting.
  • Workstations, robotic systems, AGVs, conveyors, and model machines.
  • Imagine how materials move and interact with one another.


Analysis of Material Flow

  • Logistics and inventory movement can be simulated and optimized.
  • Analyse storage and transportation procedures to eliminate bottlenecks.
  • Integrate real-time data to increase supply chain efficiency.


Optimization of Processes

  • Before making any physical alterations, consider various plant layout situations.
  • For increased efficiency, arrange workstations optimally.
  • Reduce cycle time and enhance assembly line balancing.


Workforce Planning and Resource Utilization

  • Optimize operator mobility and labour allocation.
  • Cut down on idle time and boost resource effectiveness.
  • Simulate possible risks and ergonomic issues to improve safety.


Integration of Real-Time Data and Performance Metrics

  • Create performance reports using key performance indicators (KPIs) as lead time, throughput, and utilization.
  • For dynamic simulation, integrate real-time production data with the Internet of Things.
  • To anticipate such interruptions, use predictive analytics.

Advantages of Factory Flow Simulation using DELMIA

More Effectiveness

  • Determine which activities don’t bring value and get rid of them.
  • Optimize workflow and cut down on material handling time.


Cost-Cutting

  • Optimize energy use, cut down on manufacturing delays, and minimize waste.
  • Reduce capital expenditure by remotely testing layouts and process enhancements.


Flexibility & Agility

  • Simulate several manufacturing situations in order to quickly adjust to changes in the market.
  • Analyse how new product launches affect manufacturing processes.
  • Improved ability to make decisions.
  • Insights based on data for planners and managers of factories.
  • Before implementing layout modifications, estimate their effects.

DELMIA Factory Flow Simulation Applications

  • Automotive & Aerospace: Streamline logistics and assembly lines in intricate production settings.
  • Industrial Equipment: Increase resource efficiency and machine utilization.
  • Electronics & Consumer Products: Simplify high-volume production procedures.
  • Logistics & Warehousing: Improve warehouse management and inventory flow.

Conclusion

For manufacturers looking to digitally optimize their industrial processes, DELMIA industrial Flow Simulation is revolutionary. Businesses may improve productivity, cut expenses, and streamline processes by utilizing virtual simulation, predictive analytics, and real-time data integration.

Subscribe to our newsletter

Get all the latest information on Events, Sales and Offers.