Understanding Dashboards in the 3DEXPERIENCE Platform
- Lalit Gore
- December 26, 2025
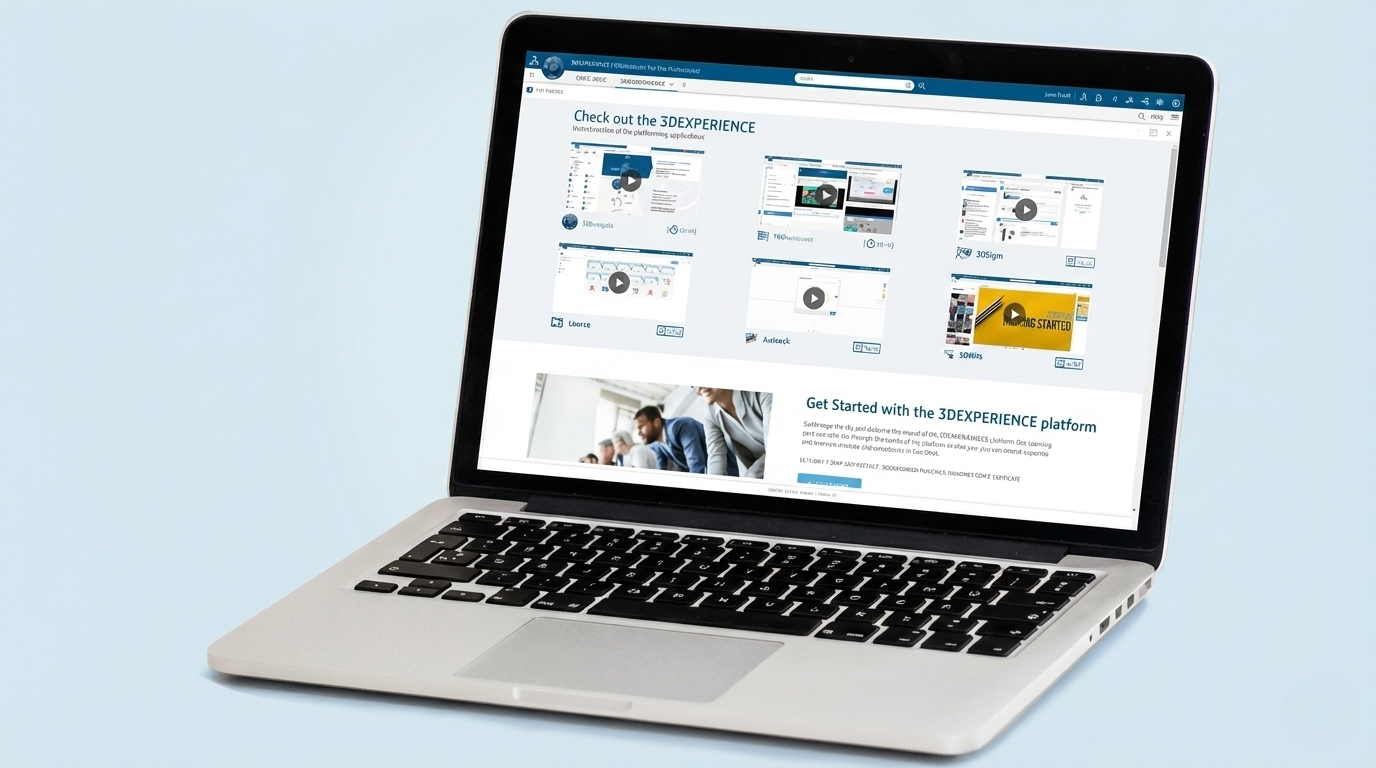
In today’s digital engineering environment, information is valuable only when it is clearly visible, well connected, and easy to understand. The 3DEXPERIENCE Platform addresses this need through Dashboards, which act as a central workspace where people, data, applications, and insights come together in a single view.
Rather than being just a visual screen, a dashboard in the 3DEXPERIENCE Platform is a personalized digital workplace that supports collaboration, decision-making, and daily engineering and business activities.
What is a Dashboard in the 3DEXPERIENCE Platform?
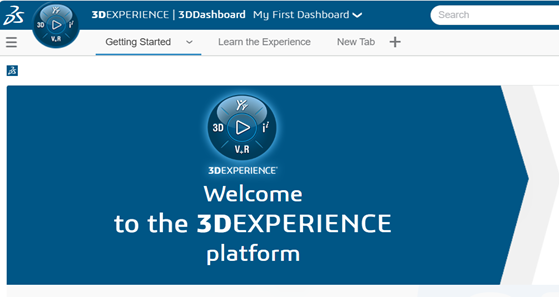
A dashboard is a configurable digital workspace that brings together different applications, data views, and collaboration tools in one place. It allows users to access relevant information without navigating across multiple systems.
Each dashboard is designed to match a specific role, responsibility, or objective—such as engineering design, project monitoring, management review, or team collaboration.
In simple terms, a dashboard answers three key questions:
- What information do I need?
- Where can I see it quickly?
- How can I interact with it efficiently?
What is Inside a Dashboard?
A dashboard is made up of tabs and widgets, each serving a distinct purpose.
Tabs – Organizing Information
Tabs help structure information logically within a dashboard. Each tab can focus on a specific theme such as:
- Design data overview
- Project status
- Team collaboration
- Reports and analytics
This separation keeps information clean, organized, and easy to navigate.
Widgets – Functional Building Blocks
Widgets are the core elements inside a dashboard. Each widget represents an application or information view. Widgets can display, analyze, or interact with data depending on their purpose.
Common widget categories include:
- Information widgets for viewing data, documents, or web content
- Collaboration widgets for discussions, notes, and shared knowledge
- Analytical widgets for charts, reports, and performance indicators
- Utility widgets for quick links, calculations, or embedded tools
Together, widgets transform a dashboard into a live, interactive workspace rather than a static display.
Meaning and Purpose of Dashboards
Dashboards in the 3DEXPERIENCE Platform are designed to provide contextual intelligence. This means information is not isolated; it is connected and meaningful.
Key purposes include:
- Bringing scattered information into one trusted location
- Providing real-time visibility into projects and data
- Reducing dependency on emails, spreadsheets, and disconnected tools
- Enabling faster understanding and better decisions
A well-designed dashboard acts as a single source of truth for teams and organizations.
How Dashboards Are Used in Practice
- Dashboards adapt to different users and business needs.
- Engineers use dashboards to access design data, standards, references, and related discussions.
- Project managers rely on dashboards to monitor progress, risks, and deliverables.
- Management teams use dashboards for high-level insights, reports, and decision support.
- Cross-functional teams collaborate using shared dashboards that combine technical and business views.
- Because dashboards are role-based, each user sees information that is relevant, authorized, and meaningful to them.
Collaboration Through Dashboards
Dashboards are not isolated personal tools. They are designed to support collaboration and knowledge sharing.
- Teams can use dashboards to:
- Share common views of data
- Exchange ideas and feedback around content
- Maintain transparency across roles and departments
- Build collective understanding instead of siloed information
This collaborative nature helps organizations move from individual work to connected teamwork.
Personalization and Flexibility
One of the key strengths of dashboards is their flexibility. Dashboards can be personalized based on:
- User role
- Project needs
- Business objectives
- Individual working style
This ensures that dashboards evolve with changing requirements while remaining structured and reliable.
Value of Dashboards in Digital Transformation
Dashboards play a critical role in digital transformation by:
- Improving visibility across the product lifecycle
- Enhancing collaboration between people and systems
- Supporting data-driven decision-making
- Reducing complexity in daily operations
They act as a bridge between data, people, and processes, making digital platforms truly usable and impactful.
Conclusion
Dashboards in the 3DEXPERIENCE Platform are much more than visual layouts. They are intelligent digital workspaces that organize information, connect teams, and enable smarter ways of working.
By bringing together data, applications, and collaboration in one place, dashboards help organizations improve clarity, efficiency, and innovation.
At EDS Technologies, we help customers design and adopt dashboards that align with their roles, workflows, and business goals—ensuring they gain real value from the 3DEXPERIENCE Platform.

Recent Posts
-
Enhancing Product Understanding through 3D Technical Illustrator
The 3D Technical Illustrator role within the 3DEXPERIENCE Platform enables organizations to transform complex engineering data into clear, interactive, and visually rich technical documentation. In…
-
Transforming Physical Parts into Digital Models with CATIA 3DEXPERIENCE Reverse Engineer role
Reverse engineering has become a critical capability in modern product development, especially when working with legacy components, competitor benchmarking, or physical prototypes that lack digital…
-
Fixing Search Service Down Issue in 3DEXPERIENCE Platform
Search is one of the most critical features in the 3DEXPERIENCE platform. If the search service goes down, users cannot find objects, documents, or data—impacting…
-
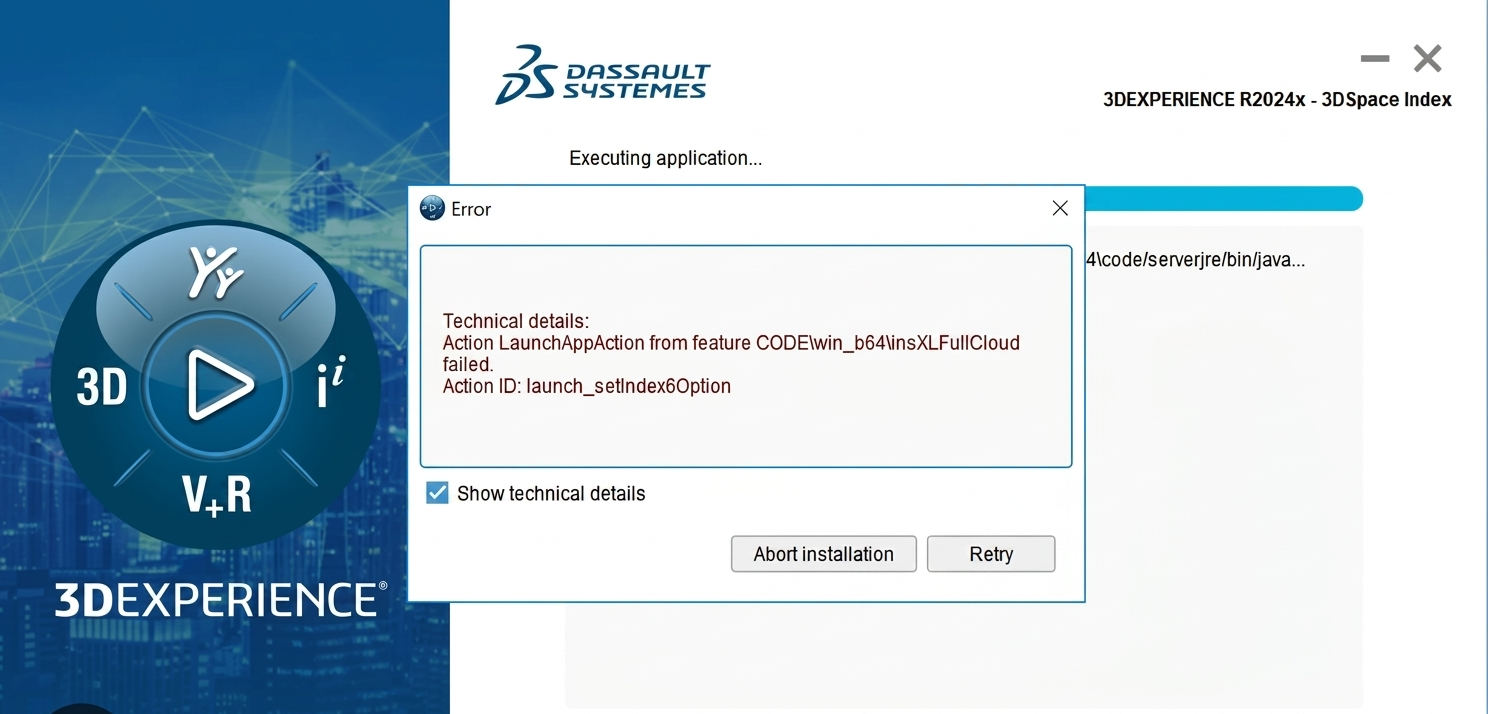
Common Installation Errors and How to Fix Them in 3DEXPERIENCE
The 3DEXPERIENCE Platform is a powerful solution used by industries worldwide for product lifecycle management (PLM), simulation, and collaboration. However, installing 3DEXPERIENCE—especially on-premise—can be complex…
-

From Classroom to Industry: Empowering Future Engineers with the 3DEXPERIENCE Platform
In today’s fast-evolving engineering and design landscape, educational institutions must go beyond conventional CAD teaching methods. While standalone tools like CATIA V5, SOLIDWORKS, or traditional…
-
CATIA Composer – Transforming Engineering Data into Interactive Technical Documentation
CATIA Composer is a powerful desktop application from Dassault Systemes designed to transform engineering 3D CAD data into highly intuitive and interactive technical documentation. In…
-
3DEXPERIENCE CATIA Composite Design – Delivering Next-Generation Precision for Advanced Composite Structures
3DEXPERIENCE CATIA Composite Design is an advanced, collaborative, and highly integrated engineering solution designed to manage the complexity of modern composite structures used across aerospace,…
-

Keysight Optical Simulation Solutions: Innovation in Optical Design
Leveraging Keysight’s portfolio of optical and photonic design and simulation software one can accurately model all facets of an optical system. These advanced and interactive…
- Lalit Gore
- December 26, 2025
Understanding Dashboards in the 3DEXPERIENCE Platform
In today’s digital engineering environment, information is valuable only when it is clearly visible, well connected, and easy to understand. The 3DEXPERIENCE Platform addresses this need through Dashboards, which act as a central workspace where people, data, applications, and insights come together in a single view.
Rather than being just a visual screen, a dashboard in the 3DEXPERIENCE Platform is a personalized digital workplace that supports collaboration, decision-making, and daily engineering and business activities.
What is a Dashboard in the 3DEXPERIENCE Platform?
A dashboard is a configurable digital workspace that brings together different applications, data views, and collaboration tools in one place. It allows users to access relevant information without navigating across multiple systems.
Each dashboard is designed to match a specific role, responsibility, or objective—such as engineering design, project monitoring, management review, or team collaboration.
In simple terms, a dashboard answers three key questions:
- What information do I need?
- Where can I see it quickly?
- How can I interact with it efficiently?
What is Inside a Dashboard?
A dashboard is made up of tabs and widgets, each serving a distinct purpose.
Tabs – Organizing Information
Tabs help structure information logically within a dashboard. Each tab can focus on a specific theme such as:
- Design data overview
- Project status
- Team collaboration
- Reports and analytics
This separation keeps information clean, organized, and easy to navigate.
Widgets – Functional Building Blocks
Widgets are the core elements inside a dashboard. Each widget represents an application or information view. Widgets can display, analyze, or interact with data depending on their purpose.
Common widget categories include:
- Information widgets for viewing data, documents, or web content
- Collaboration widgets for discussions, notes, and shared knowledge
- Analytical widgets for charts, reports, and performance indicators
- Utility widgets for quick links, calculations, or embedded tools
Together, widgets transform a dashboard into a live, interactive workspace rather than a static display.
Meaning and Purpose of Dashboards
Dashboards in the 3DEXPERIENCE Platform are designed to provide contextual intelligence. This means information is not isolated; it is connected and meaningful.
Key purposes include:
- Bringing scattered information into one trusted location
- Providing real-time visibility into projects and data
- Reducing dependency on emails, spreadsheets, and disconnected tools
- Enabling faster understanding and better decisions
A well-designed dashboard acts as a single source of truth for teams and organizations.
How Dashboards Are Used in Practice
- Dashboards adapt to different users and business needs.
- Engineers use dashboards to access design data, standards, references, and related discussions.
- Project managers rely on dashboards to monitor progress, risks, and deliverables.
- Management teams use dashboards for high-level insights, reports, and decision support.
- Cross-functional teams collaborate using shared dashboards that combine technical and business views.
- Because dashboards are role-based, each user sees information that is relevant, authorized, and meaningful to them.
Collaboration Through Dashboards
Dashboards are not isolated personal tools. They are designed to support collaboration and knowledge sharing.
- Teams can use dashboards to:
- Share common views of data
- Exchange ideas and feedback around content
- Maintain transparency across roles and departments
- Build collective understanding instead of siloed information
This collaborative nature helps organizations move from individual work to connected teamwork.
Personalization and Flexibility
One of the key strengths of dashboards is their flexibility. Dashboards can be personalized based on:
- User role
- Project needs
- Business objectives
- Individual working style
This ensures that dashboards evolve with changing requirements while remaining structured and reliable.
Value of Dashboards in Digital Transformation
Dashboards play a critical role in digital transformation by:
- Improving visibility across the product lifecycle
- Enhancing collaboration between people and systems
- Supporting data-driven decision-making
- Reducing complexity in daily operations
They act as a bridge between data, people, and processes, making digital platforms truly usable and impactful.
Conclusion
Dashboards in the 3DEXPERIENCE Platform are much more than visual layouts. They are intelligent digital workspaces that organize information, connect teams, and enable smarter ways of working.
By bringing together data, applications, and collaboration in one place, dashboards help organizations improve clarity, efficiency, and innovation.
At EDS Technologies, we help customers design and adopt dashboards that align with their roles, workflows, and business goals—ensuring they gain real value from the 3DEXPERIENCE Platform.