Simplifying Complex Automotive Meshing with Surface Wrap in 3DEXPERIENCE

In fluid simulation, especially in automotive applications, managing complex geometries like the underbody of a car can be one of the most challenging aspects of the meshing process. Small features – such as gaps between panels, minor protrusions, or tiny edge details – can significantly increase the computational complexity, time, and even lead to solver instability.

The Surface Wrap functionality in the 3DEXPERIENCE Platform – available through the SIMULIA Fluid Model Creation app – provides a powerful solution to this problem. It enables engineers to automatically seal, smooth, and simplify complicated CAD models while maintaining the essential flow paths.

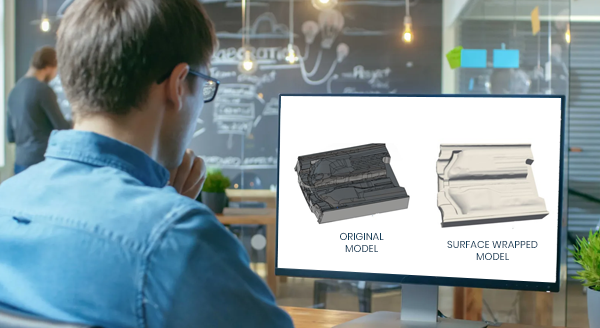
What Does the Image Show?

Left: Original car underbody with gaps and intricate features
Right: Surface-wrapped model, smoothed and meshing-ready

The image clearly demonstrates the before and after effects of surface wrapping:

  • On the left, the raw geometry contains multiple gaps, crevices, and small edges – making it difficult to generate a high-quality mesh.
  • On the right, after applying surface wrap, the same geometry is simplified and continuous, making it ideal for efficient Hex-Dominant Meshing.

This transformation is not just visual; it drastically improves mesh quality, reduces element count, and increases solver performance.


What Is Surface Wrap and Why Is It Important?

Surface Wrap is a preprocessing step that cleans up geometry by:

  • Filling small gaps between parts (e.g., < 5 mm)
  • Removing tiny, unnecessary edges and features
  • Generating a smoothed, watertight external surface
  • Enabling a robust and automated meshing process

This is especially useful in automotive CFD simulations, where:

  • Components like bonnets, pillars, and mirrors often have narrow clearances
  • Details like screws, slots, and vents don’t contribute to major flow changes
  • Full-vehicle external flow simulations demand clean geometry

Without surface wrapping, engineers would need to manually simplify geometry or spend time troubleshooting mesh failures.


Real Impact: Drastic Reduction in Mesh Complexity

Using Surface Wrap, you can reduce the mesh element count by more than 60% in many cases. For example:

  • A model with small 2 mm gaps can generate over 53,000 mesh elements.
  • When wrapped with a 3 mm wrap size, the mesh is reduced to less than 20,000 elements.

This leads to:

  • Shorter meshing time
  • Faster simulation runs
  • Fewer convergence issues


How It Works in 3DEXPERIENCE

When defining the Fluid Domain, the user simply:

  1. Enables the “Mesh with surface wrap” checkbox.
  2. Sets a minimum wrap size – usually larger than the smallest geometric gap to be ignored.
  3. Proceeds with Hex-Dominant Mesh (HDM) generation.

The software automatically:

  • Detects and seals small open edges
  • Smooths over redundant geometry
  • Generates a clean, unified surface for meshing

Once meshed, users can visualize the wrapped surface with or without edge highlighting, ensuring confidence in the final geometry.

Why It Matters

Without Surface Wrap:

  • Tiny features force finer meshes
  • Increased computation time
  • Risk of mesh failure or simulation error

With Surface Wrap:

  • Geometry is simulation-ready
  • Mesh generation is faster and cleaner
  • Better control over mesh size and quality

For automotive engineers simulating aerodynamics or underbody flow, this is a game-changing step that shifts focus from cleanup to innovation.

Conclusion

The Surface Wrap tool in the 3DEXPERIENCE Platform isn’t just a convenience – it’s a necessity for handling the complex realities of modern automotive design. Even a chaotic geometry like a car’s underbody becomes clean, streamlined, and simulation-ready with just a few intelligent preprocessing steps.

This not only saves engineering time and effort, but also boosts simulation accuracy, efficiency, and reliability. For any team working on external fluid dynamics, HVAC, or thermal management – Surface Wrap is the silent hero behind a successful CFD workflow.

Beyond the Test Track: The Virtual Leap in Automotive Lighting Assessment

The adoption of innovative technologies such as virtual reality and visual interface in the automotive sector is significantly transforming design visualization. This is also extended to the exterior lighting systems of vehicles. It is crucial to realize the performance of automotive front lighting systems during night driving scenarios where visibility plays a vital role in ensuring safety of drivers and other road users. Factors such as light beam distribution, veiling glare, and optimal visibility must be tested under actual on-road conditions to accurately assess headlamp performance.

Traditionally, beam pattern analysis is carried out on test tracks using physical measuring devices. This approach is restrictive as it necessitates physical headlamp systems for testing, which are only accessible during the final stages of product development and is ineffective for dynamic testing, particularly with the new lamp systems that feature AFS (Adaptive Front-lighting System) and ADB (Adaptive Driving Beam). Additionally, adverse weather conditions and varying environmental factors such as ambient lighting and humidity will prolong the duration of testing. This results in increased costs and resource usage, with minimal opportunity for product enhancement.

LucidDrive, a night driving simulator helps assess automotive headlamps with an emphasis on visual analysis of headlamp light distribution in various road scenarios. It provides a virtual test drive in realistic driving environments. It is an interactive tool with the ability to switch between different lamp sets, driver view positions and road types.


Creating Custom Roads & Realistic Driving Scenarios

  • Road Editor tool helps create custom test tracks and various road scenes like city or country roads, bridges, tunnels and highways, using just the polyline or spline curves.
  • Overhead sign boards, trees, poles, road markers and pedestrians can be added to create realistic driving scenarios.


Beam Pattern Analysis of Headlamps

  • Mount different headlamps by defining their separation widths, height and aiming positions.
  • Switch between various sets of headlamps to see the differences in beam patterns
  • Define distance marker lines to provide target positions for visibility benchmarking.
  • Add sensors on road, sign boards and other vehicles to determine the lux values at various locations.


Simulate Pixel Light Technology with AFS Masking

LucidDrive simulates pixel light technology by detecting oncoming or overtaking traffic, and calculating bounding boxes. Defining a dimming matrix to quickly configure pixel light distributions. The sensor allows storage of dynamic light distribution and dimming matrix for each frame.


Realistic Traffic Simulations

  • Set user-defined parameters, such as vehicle speed, acceleration, deceleration and braking capabilities.
  • Simulate customized vehicle behaviour such as lane changing and overtaking.

This feature provides realistic simulations of headlight response to dynamic traffic and road conditions.


Multiple Views of Headlamp Beam Patterns

This feature helps compare multiple headlamp beam patterns simultaneously. It enables to determine the most optimal light distribution when different design configurations are being tested.  For spectrally generated intensity distribution (.LID/.IES), it is possible to view colour dispersion effects. It also offers different view positions such as the driver’s view, bird’s eye view, drone and pedestrian view which helps visualize the extent of the beam footprint over a large area.

The integration of this visual technology in new product development process will help envision the complete market ready product without the need for any physical prototypes. This improves qualitative decision making and substantially reduces development time and costs.

From Engineering to Service: Unified BOM is the Future of Product Lifecycle

In the era of digital transformation, managing a product’s lifecycle efficiently is critical. As product complexity increases and global collaboration becomes the norm, traditional siloed BOM approaches where Engineering BOM (E-BOM), Manufacturing BOM (M-BOM), and Service BOM (S-BOM) are maintained separately, lead to major challenges such as:

  • Data Inconsistencies: Different departments often work on different versions of the product structure, leading to misalignment between design, manufacturing, and service functions
  • Manual Data Duplication: Maintaining BOMs in separate systems leads to duplicate data entry and higher risk of errors
  • Inadequate Change Tracking: When E-BOM, M-BOM, and S-BOM are not synchronized, tracking and implementing changes across the product lifecycle becomes difficult, delaying product releases and increasing costs
  • Lack of Collaboration: Isolated BOM’s hinder team collaboration, leading to designs that are hard to manufacture or service due to lack of early input from downstream teams
  • Delayed Time-to-Market: Disconnected processes slow down development cycles, with BOM mismatches causing delays in manufacturing and service readiness
  • Increased Cost and Rework: Without a unified BOM, errors propagate downstream, leading to rework, scrap, warranty claims, and higher support costs.

Challenges of Siloed BOM’s

Maintaining separate BOM’s causes several operational bottlenecks like:

  • Manual Data Entry
  • Poor Change Traceability
  • Design-to-Manufacture Gaps
  • Limited Reuse
  • Data Duplication

What is Unified BOM Management?

Unified BOM Management refers to maintaining a single, consistent product structure that can be extended and tailored across multiple departments – Engineering, Manufacturing, and Service. Instead of working in silos, teams can collaborate using a common data model.

Model-based Engineering is the backbone that supports real-time collaboration, traceability, and change propagation across departments.


Unified BOM Is Not Just a Trend – It’s a Necessity

To stay competitive in today’s connected, product-as-a-service world, businesses must adopt a Unified BOM strategy. It enables seamless collaboration, faster product development, and more efficient service delivery.

Organizations should think about unifying engineering, manufacturing, and service data into a cohesive digital model, ensuring end-to-end visibility and agility.


How 3DEXPERIENCE Platform fosters Unified BOM Management

The 3DEXPERIENCE Platform fosters a Unified Bill of Materials (BOM) Management by providing a centralized and collaborative environment that integrates people, processes, and data across the entire product lifecycle. It enables unified BOM management through the following key capabilities:

  • Collaborative Engineering Definition: Enables cross-functional teams to define and manage the engineering BOM in a shared digital environment.


  • Collaborative Engineering to Manufacturing: Ensures seamless transformation of the engineering BOM into a manufacturing BOM, supporting alignment between design and production


  • Service Process Engineering: Extends BOM usability into service planning by incorporating service requirements and creating service BOM’s linked to the product definition

To get more information & insights on how the 3DEXPERIENCE Platform drives Unified BOM Management, please reach out to us at marketing@edstechnologies.com 

Unlocking the Power of Pure Copper with EOS M290 1kW system

In the evolving world of Additive Manufacturing (AM), precision, performance, and material integrity are critical. One of the most transformative developments in this field is the ability to 3D print pure copper and copper alloys with high electrical and thermal conductivity — materials once considered extremely challenging due to their reflectivity and thermal behavior.

Thanks to the advancements in EOS metal 3D printing systems, particularly the EOS M 290 with 1kW laser configuration developed by AMCM (an EOS Group company), manufacturing complex, high-performance copper parts is now a reality.


Why Print with Pure Copper?

Pure copper is renowned for its exceptional conductivity, but its high reflectivity and thermal conductivity pose significant hurdles in laser-based 3D printing. EOS has overcome this with tailored process parameters and specialized hardware:

Copper and its alloys are vital for applications such as:

  • Heat exchangers
  • Electrical connectors and windings
  • Rocket engine components
  • Induction coils
  • Marine impellers

Traditionally, producing complex geometries in these materials was time-consuming, wasteful, and restrictive. With Direct Metal Laser Solidification (DMLS), EOS enables geometrical freedom, material efficiency, and functional performance — redefining how copper is used in manufacturing.


EOS Copper Portfolio at a Glance

EOS Copper Cu (Pure Copper for EOS M 290 – 400W Laser)

  • Conductivity: >90% IACS (heat-treated)
  • Mechanical Strength: 180 MPa yield, 200 MPa tensile
  • Layer Thickness: 20 µm
  • Use Case: Early adoption and R&D for heat exchangers, electronics

A solid choice for foundational pure copper applications where moderate build rates and high conductivity are essential.


EOS Copper CuCP (Commercially Pure Copper for AMCM M 290 – 1kW Laser)

  • Purity: >99.95%
  • Conductivity: Up to 102.6% IACS (heat-treated)
  • Elongation at Break: Up to 55%
  • Layer Thickness: 40 µm
  • Volume Rate: 5.4 mm³/s
  • TRL: 5
  • Use Case: Inductors, high-current connectors, electric motors

With dual exposure strategies (bulk and application-specific), CuCP balances conductivity, productivity, and repeatability — even across multiple powder reuses.


EOS CopperAlloy CuCrZr (Strength + Conductivity for AMCM M 290 – 1kW Laser)

  • Yield Strength (HT): 210 MPa
  • Tensile Strength (HT): 340 MPa
  • Conductivity (HT): >80% IACS
  • Volume Rate: 15.4 mm³/s
  • Layer Thickness: 80 µm
  • Use Case: Rocket nozzles, high-stress coils, heat sinks

An ideal choice for components requiring durability under heat and pressure — bridging structural integrity with electrical function.


EOS Copper Alloy CuNi30 (Saltwater-Resistant Alloy for EOS M 290 & M 400-1)

  • Excellent corrosion resistance in salt water
  • Yield Strength (HT): Up to 560 MPa
  • Tensile Strength (HT): Up to 700 MPa
  • Layer Thickness: 60 µm
  • Volume Rate: 5.2 mm³/s
  • Use Case: Marine parts, impellers, offshore pump housings

CuNi30 offers marine-grade protection and strength — performing reliably even in low temperatures and aggressive environments.


Built on the EOS Quality Triangle

Every material developed by EOS aligns with its Quality Triangle: System, Material, and Process. This ensures consistent, repeatable results — whether you’re building a powertrain coil, a marine pump, or a next-gen electric drive.

From TRL 3 exploratory materials to TRL 7+ validated products, EOS supports the entire adoption curve — from research to production.


Real Impact, Real Innovation

EOS metal systems make what was once impossible, now industrially viable:

  • High conductivity copper parts printed directly, with minimal post-processing
  • Optimized exposure strategies for delicate features like windings and thin walls
  • Heat treatments tailored for specific mechanical and thermal outcomes
  • Minimized defects, even after multiple powder reuses

The convergence of material science, laser power, and process know-how empowers designers and engineers to innovate without constraint.


EOS Metal Systems: Tailored for Copper Printing

EOS doesn’t just supply powders — it delivers a complete solution. Their Quality Triangle approach integrates system, material, and process, ensuring consistent output across industries. EOS M 290 configurations (standard and 1kW variants) deliver:

  • Closed-loop thermal monitoring
  • Precision recoating mechanisms
  • Software-controlled exposure profiles
  • Compatibility with argon-protected atmospheres for material purity

Final Thoughts: Applications Driving Demand

Industries such as aerospace, automotive, energy, and electronics are increasingly adopting copper AM parts for:

  • Weight-optimized heat sinks and exchangers
  • Compact, complex geometries in RF and inductive components
  • Conformal cooling and embedded circuitry in power systems

By enabling the additive manufacture of high-conductivity copper and alloy parts, EOS empowers engineers to design for function without compromise — ushering in a new era of metal AM performance.

3D MIDs with Aerosol Jet Technology by Optomec

In the rapidly evolving landscape of electronics manufacturing, the demand for compact, lightweight, and multifunctional components is higher than ever. One such innovation answering this call is the 3D Molded Interconnect Device (3D MID) — a technology that seamlessly integrates mechanical and electronic functions into a single, three-dimensional component. And at the forefront of enabling this revolution is Optomec’s Aerosol Jet® technology, a game-changer in the world of additive manufacturing.


What is 3D MID?

3D MIDs combine plastic parts with integrated electronic circuitry, replacing traditional PCB assemblies. Instead of mounting a PCB into a moulded housing, the circuitry is directly printed onto the housing itself. This eliminates the need for connectors, cables, and additional assemblies—resulting in lighter, smaller, and more reliable products.

Common applications include:

  • Automotive sensor housings
  • Wearable devices
  • Medical instruments
  • Consumer electronics
  • Industrial controls


Enter Optomec Aerosol Jet Technology

Optomec’s Aerosol Jet® technology enables the precise, non-contact deposition of electronic inks onto virtually any 3D surface. Unlike screen printing or inkjet methods that are limited to 2D substrates, Aerosol Jet is capable of printing ultra-fine features (as small as 10 microns) on complex geometries, including curved or contoured surfaces commonly found in 3D MID designs.

Key Advantages:

  • True 3D Conformal Printing: Ideal for printing on non-planar surfaces like injection-moulded plastics.
  • High Resolution: Circuit features as fine as 10 µm can be printed without masks or screens.
  • Material Flexibility: Compatible with a wide range of conductive inks (silver, copper, carbon) and dielectric materials.
  • Scalable and Repeatable: Production-ready for low to mid-volume manufacturing with excellent repeatability.


How it Works

  1. Ink Atomization: Liquid ink is transformed into an aerosol mist using ultrasonic or pneumatic methods.
  2. Aerosol Transport: The mist is carried by a carrier gas to the deposition head.
  3. Focused Deposition: A sheath gas surrounds the mist to focus the stream to a precise spot, enabling high-resolution printing on 3D surfaces.
  4. Post-Processing: After deposition, thermal or photonic curing is used to solidify the ink.

This process eliminates the need for traditional subtractive steps like etching or mechanical drilling, reducing material waste and speeding up production.


Industrial Impact: A New Era of Smart Products

The combination of 3D MID design and Aerosol Jet printing opens doors to a new class of smart, miniaturized products. For example:

  • In automotive: Integration of sensors and antennas directly into the car’s interior plastic panels reduces wiring and improves aesthetics.
  • In medical: Compact diagnostic devices with embedded electronics reduce the form factor without compromising functionality.
  • In wearables: Flexible, ergonomic designs can now feature embedded connectivity without the need for bulky circuit boards.


Sustainability & Cost Benefits

Aerosol Jet printing contributes to greener manufacturing by:

  • Minimizing material consumption
  • Reducing energy usage through digital processing
  • Lowering production costs with fewer process steps and less waste

It also supports design freedom, enabling rapid prototyping and agile iterations without tooling changes.


Conclusion

As devices continue to shrink and demand more functionality in less space, the synergy between 3D MID design and Optomec’s Aerosol Jet technology is setting new benchmarks in electronics manufacturing. With its ability to precisely deposit functional inks onto 3D surfaces, this technology is not just evolving how electronics are made – it’s redefining what’s possible.

Optomec Aerosol Jet is not just a tool for innovation – it’s a strategic enabler for manufacturers looking to stay ahead in a hyper-competitive market.

Resource Estimation in GEOVIA Surpac Using Geostatistics

Resource estimation is the process of quantifying the amount and grade of mineral resources within a geological deposit. It forms the foundation for feasibility studies, mine design, and financial modeling. Inaccurate estimates can lead to poor investment decisions, operational inefficiencies, and regulatory challenges. Therefore, mining professionals increasingly rely on sophisticated tools like Surpac to ensure precision and transparency.


Why Choose GEOVIA Surpac?

GEOVIA Surpac is one of the most widely used geological modeling and mine planning software platforms in the world. It supports a range of functionalities including:

– Drillhole data management
– Geological interpretation
– Block modeling
– Grade estimation
– Pit design and scheduling

Its user-friendly interface, powerful 3D visualization capabilities, and integration with geostatistical tools make it ideal for both exploration geologists and mining engineers.


Integrating Geostatistics: A Game-Changer

Geostatistics is a branch of statistics that deals with spatially correlated data. In resource estimation, it allows professionals to model the spatial distribution of grades and quantify uncertainty. Techniques such as variogram modeling, kriging, and simulation are central to this approach.

Benefits of Geostatistical Estimation:
– Improved Accuracy: Kriging provides the best linear unbiased estimate (BLUE) of unknown values.
– Quantification of Uncertainty: Helps in risk assessment and classification of resources.
– Spatial Continuity: Captures geological trends and anisotropy effectively.


Workflow: Resource Estimation in Surpac Using Geostatistics

1. Data Preparation

The process begins with importing and validating drillhole data. This includes assays, lithology, survey data, and coordinates. Ensuring data integrity is critical before proceeding to modeling.

2. Compositing

Samples are composited to a consistent length to reduce bias. Surpac allows flexible compositing based on lithological boundaries or fixed intervals.

3. Exploratory Data Analysis (EDA)

EDA involves statistical analysis of the data to understand distribution, detect outliers, and identify geological domains. Histograms, scatter plots, and log probability plots are commonly used.

4. Variography

Variograms are used to model spatial continuity. Surpac supports experimental variogram generation and fitting of theoretical models (e.g., spherical, exponential). Directional variograms help identify anisotropy, which is crucial for accurate estimation.

5. Block Model Construction

A 3D block model is created to represent the deposit. Parameters such as block size, extents, and sub-blocking are defined. Geological attributes and constraints are assigned to each block.

6. Estimation Using Kriging or ISD (Inverse Square Distance)

Kriging is the most widely used geostatistical method in Surpac. It uses the variogram model to interpolate grades into the block model. Other methods like Inverse Distance Weighting (IDW) or Co-Kriging can also be applied depending on the data and objectives.

7. Ellipsoid Search Parameters

Estimation ellipsoids define the search neighborhood for kriging. They are oriented based on geological structures and variogram directions. Surpac allows customization of ellipsoid dimensions and orientations to reflect geological anisotropy.

8. Validation and Classification

The model is validated using cross-validation, swath plots, and comparison with raw data. Resources are then classified into Measured, Indicated, and Inferred categories based on data density and estimation confidence.

9. Visualization and Reporting

Surpac’s 3D visualization tools enable professionals to view block models, grade shells, and estimation ellipsoids interactively. Reports can be generated for tonnage, grade, and classification summaries.


Promoting Best Practices in Resource Estimation

To maximize the benefits of Surpac and geostatistics, professionals should adhere to the following best practices:

– Use domain-specific variograms: Avoid applying a single model across geologically distinct zones.
– Validate at every step: Ensure consistency between input data, variograms, and estimation results.
– Document assumptions: Maintain transparency for audits and compliance.
– Collaborate across disciplines: Integrate geological, geotechnical, and metallurgical insights.


Conclusion: A Strategic Advantage

In today’s competitive mining landscape, the ability to produce accurate and auditable resource estimates is a strategic advantage. GEOVIA Surpac, when combined with geostatistical methods, empowers professionals to model complex deposits with confidence. From exploration to production, this integrated approach enhances decision-making, reduces risk, and supports sustainable resource development.

Whether you are a geologist, mining engineer, or resource analyst, mastering Surpac and geostatistics is an investment in precision, professionalism, and performance.

Subscribe to our newsletter

Get all the latest information on Events, Sales and Offers.