Which Licenses Are Really Being Used? Deep Dive into DSLS Utilization Metrics
- Akshay Hedaoo
- December 15, 2025
Engineering and design organizations invest heavily in Dassault Systemes software — including CATIA, ENOVIA, SIMULIA, DELMIA, and 3DEXPERIENCE platform roles. However, despite the scale of this investment, many teams struggle to answer one critical operational question:
“Are we truly utilizing our licenses efficiently?”
Understanding who is using what license, when, and how often can significantly reduce renewal costs, eliminate bottlenecks, and support strategic planning. This blog will guide you through monitoring and analyzing Dassault Systemes License Server (DSLS) utilization data — across hourly, daily, and monthly timeframes — to help you optimize license usage and make informed decisions.
Why License Utilization Tracking Is Essential
Monitoring and analyzing DS License Server utilization offers multiple organizational benefits:
- Prevent license shortages during peak working hours
- Identify unused or rarely used licenses and avoid overprovisioning
- Support renewal decisions with actual usage data
- Enable proactive capacity planning
- Reduce idle check-outs and improve availability
- Ensure compliance with Dassault Systemes licensing terms
Key Metrics to Track
For accurate insights, organizations should measure:
- License Type Utilization
Track usage per module or role, rather than just total consumption.
Examples:
| License Feature | Module Type | Status |
| MD2 | CATIA Mechanical Design | High usage |
| AME | Assembly & Manufacturing | Moderate |
| SIMULIA Abaqus | Simulation | Seasonal peaks |
- Time-Based Usage Trends
Understanding temporal license usage helps identify patterns and bottlenecks.
| Metric | Purpose |
| Monthly Trends | Budgeting & renewal planning |
| Daily Variations | Identify peak working days |
| Hourly Patterns | Detect rush hours & underutilized time windows |
- User-Based Tracking
Monitoring at user level helps identify:
- Heavy consumers
- Idle seat holders
- License hoarding behaviors
Useful for internal audits and reallocation.
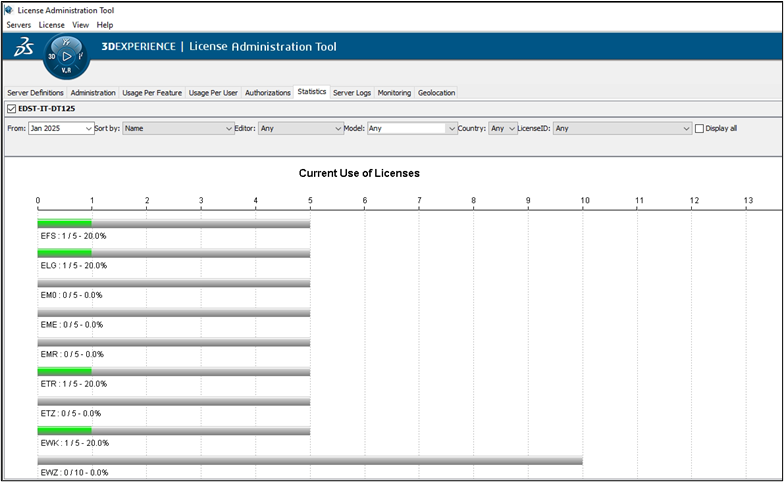
- Available vs. Utilized Capacity
Compare:
| Metric | Meaning |
| Total Purchased Licenses | Your entitlement |
| Current Usage | Active checked-out seats |
| Peak Usage | Maximum concurrent usage |
| Idle % | Unused capacity ratio |
How to Monitor License Utilization in DSLS
Dassault Systemes provides both GUI and CLI-based tools to visualize and extract usage data.
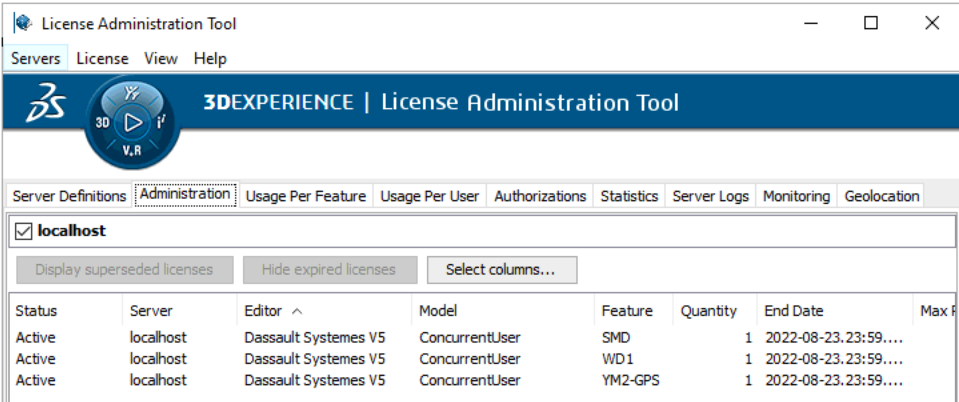
Option 1: Using the DS License Administration Tool (GUI)
Steps:
- Open:
- Windows: Start → Dassault Systemes → License Administration
- Linux:
- /usr/DassaultSystemes/DSLS/linux_a64/code/bin/DSLicSrv (path may vary)
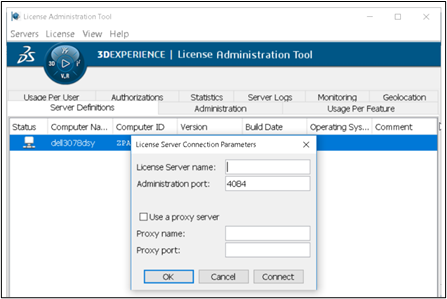
- Connect to the license server using its hostname/IP and default port (4085 unless modified).
- Navigate to the License Usage tab to view:
- Feature name
- Number of seats in use
- Active users
- Check-out duration
⚠ GUI primarily shows real-time usage only, not historical trends.
Option 2: Using the lic-admin CLI Tool
Common Commands:
| Command | Purpose |
| licadmin -usage -all | View all active license sessions |
| licadmin -available | Display remaining vs total licenses |
| licadmin -status | Check server health & uptime |
These commands can be scripted and scheduled for automation.
Option 3: Historical Log Parsing (Recommended)
DSLS maintains logs at:
- Windows: C:\ProgramData\DassaultSystemes\DSLS\logs\
- Linux: /var/DSLS/log/DSLicSrv.log
A script (Python/PowerShell) can extract:
- Username
- Feature name
- Checkout time
- Check-in time
- Host machine
Generating CSV, Excel, Heatmaps, and Dashboard Visuals provides deep insight.
Sample Utilization Dashboard (Visualization Proposal)
| License Type | Total Seats | Peak Usage | Least Used Hour | Usage Score | Action |
| CATIA MD2 | 10 | 9 (Mon 10AM) | Weekends | ★★★★★ | Retain |
| SIMULIA ABAQUS | 5 | 5 (Wed 2PM) | Early morning | ★★★★☆ | Add 1 or optimize |
| ENOVIA | 8 | 3 | Evenings | ★★☆☆☆ | Reduce or reassign |
(Insert chart visualization: heatmap or trend line)
For Monitoring of license usage
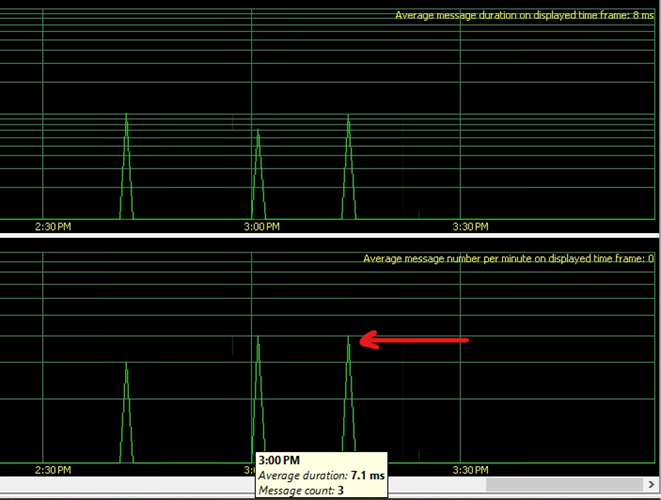
The Monitoring tab provides real-time and historical information about license activity: who is using a license, when they checked it out, denial events, borrow history, and server health.
It typically contains several sub-sections:
Shows events where a user attempted to check out a license but none were available, license server activity and Borrowed licenses for usage tracking
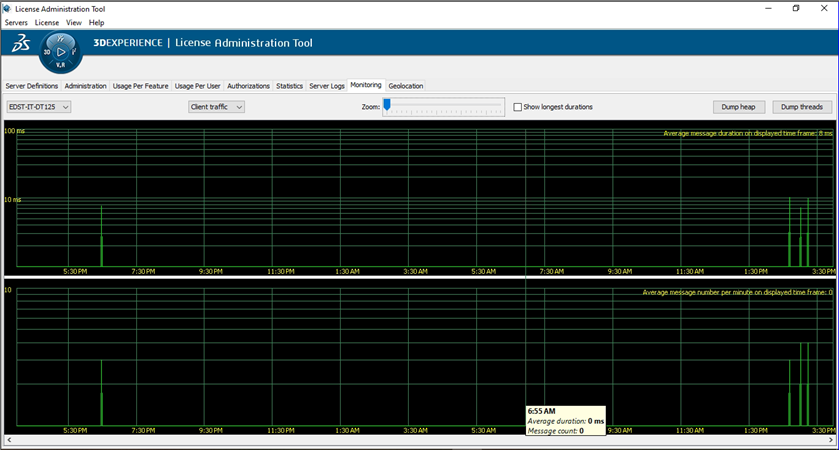
Details of licenses used per timing
Advanced Enhancements
- Automation & Scheduling
- Schedule hourly DSLS CLI exports
- Auto-email reports via scripts
- Integrate with Power BI, Tableau, Excel Power Query
- Governance Best Practices
- Idle session timeout policy
- License borrowing policy
- User education on returning licenses
KPIs to Measure
| KPI | Target Example |
| Peak Usage % | >80% |
| Idle License % | <20% |
| Concurrent Usage Growth | Year-over-year trend |
| License Borrowing Compliance | 100% |
Recommendations
After analyzing usage:
- Reduce under-used licenses
- Reallocate expensive roles to critical users
- Enable “auto return” to prevent hoarding
- Optimize workloads (simulation batch runs during low usage hours)
Final Thoughts
Strategic license management is not only about cost optimization — it is about ensuring productivity, availability, and scalability across engineering teams. With structured tracking, reporting, and optimization, Dassault Systèmes customers can ensure:
- Better utilization
- Data-driven renewals
- Faster workflows
- Improved user experience
When you measure usage — you gain control. When you optimize usage — you gain value.

Recent Posts
-

3DEXPERIENCE CATIA Composite Design – Delivering Next-Generation Precision for Advanced Composite Structures
3DEXPERIENCE CATIA Composite Design is an advanced, collaborative, and highly integrated engineering solution designed to manage the complexity of modern composite structures used across aerospace,…
-

Innovating with Light: Advanced Optical Solutions for Automotive, Medical, and Photonic Systems
The rapidly evolving optical industry demands cutting-edge systems with exceptional precision and accuracy. As the market for these advanced solutions grows, engineers and manufacturers must…
-
Parametric Modeling to Improve Design Efficiency in 3DEXPERIENCE CATIA
Parametric modeling is more than applying dimensions and constraints – it is about capturing design intent so that changes can be made without rework. In 3DEXPERIENCE CATIA, well-planned parametric models reduce redesign time, improve collaboration,…
-

Configuring Collaborative Spaces in 3DEXPERIENCE for Large Teams
In large organizations, effective collaboration is critical. 3DEXPERIENCE provides Collaborative Spaces, enabling teams to work concurrently on designs, manage data securely, and maintain version control.…
-
3DEXPERIENCE Web Apps – A Complete Guide to Classic Web Applications
The 3DEXPERIENCE Web Apps – Classic User’s Guide explains the common tools, user interface, and functionalities provided by Collaboration and Approvals, which are used across…
-

3DEXPERIENCE in the Automotive Industry: Use Cases & Benefits for OEMs, Tier-1 Suppliers, and EV Manufacturers
The automotive industry is evolving at an unprecedented pace. OEMs are under pressure to reduce time to market, Tier-1 suppliers must align closely with multiple…
-
Understanding Dashboards in the 3DEXPERIENCE Platform
In today’s digital engineering environment, information is valuable only when it is clearly visible, well connected, and easy to understand. The 3DEXPERIENCE Platform addresses this…
-

3DEXPERIENCE Native Apps: A Unified, Intelligent Design Environment
The 3DEXPERIENCE Native Apps form the core working environment for designers, engineers, and collaborators who require powerful authoring, visualization, and data management capabilities directly on…
- Akshay Hedaoo
- December 15, 2025
Which Licenses Are Really Being Used? Deep Dive into DSLS Utilization Metrics
Engineering and design organizations invest heavily in Dassault Systemes software — including CATIA, ENOVIA, SIMULIA, DELMIA, and 3DEXPERIENCE platform roles. However, despite the scale of this investment, many teams struggle to answer one critical operational question:
“Are we truly utilizing our licenses efficiently?”
Understanding who is using what license, when, and how often can significantly reduce renewal costs, eliminate bottlenecks, and support strategic planning. This blog will guide you through monitoring and analyzing Dassault Systemes License Server (DSLS) utilization data — across hourly, daily, and monthly timeframes — to help you optimize license usage and make informed decisions.
Why License Utilization Tracking Is Essential
Monitoring and analyzing DS License Server utilization offers multiple organizational benefits:
- Prevent license shortages during peak working hours
- Identify unused or rarely used licenses and avoid overprovisioning
- Support renewal decisions with actual usage data
- Enable proactive capacity planning
- Reduce idle check-outs and improve availability
- Ensure compliance with Dassault Systemes licensing terms
Key Metrics to Track
For accurate insights, organizations should measure:
- License Type Utilization
Track usage per module or role, rather than just total consumption.
Examples:
| License Feature | Module Type | Status |
| MD2 | CATIA Mechanical Design | High usage |
| AME | Assembly & Manufacturing | Moderate |
| SIMULIA Abaqus | Simulation | Seasonal peaks |
- Time-Based Usage Trends
Understanding temporal license usage helps identify patterns and bottlenecks.
| Metric | Purpose |
| Monthly Trends | Budgeting & renewal planning |
| Daily Variations | Identify peak working days |
| Hourly Patterns | Detect rush hours & underutilized time windows |
- User-Based Tracking
Monitoring at user level helps identify:
- Heavy consumers
- Idle seat holders
- License hoarding behaviors
Useful for internal audits and reallocation.
- Available vs. Utilized Capacity
Compare:
| Metric | Meaning |
| Total Purchased Licenses | Your entitlement |
| Current Usage | Active checked-out seats |
| Peak Usage | Maximum concurrent usage |
| Idle % | Unused capacity ratio |
How to Monitor License Utilization in DSLS
Dassault Systemes provides both GUI and CLI-based tools to visualize and extract usage data.
Option 1: Using the DS License Administration Tool (GUI)
Steps:
- Open:
- Windows: Start → Dassault Systemes → License Administration
- Linux:
- /usr/DassaultSystemes/DSLS/linux_a64/code/bin/DSLicSrv (path may vary)
- Connect to the license server using its hostname/IP and default port (4085 unless modified).
- Navigate to the License Usage tab to view:
- Feature name
- Number of seats in use
- Active users
- Check-out duration
⚠ GUI primarily shows real-time usage only, not historical trends.
Option 2: Using the lic-admin CLI Tool
Common Commands:
| Command | Purpose |
| licadmin -usage -all | View all active license sessions |
| licadmin -available | Display remaining vs total licenses |
| licadmin -status | Check server health & uptime |
These commands can be scripted and scheduled for automation.
Option 3: Historical Log Parsing (Recommended)
DSLS maintains logs at:
- Windows: C:\ProgramData\DassaultSystemes\DSLS\logs\
- Linux: /var/DSLS/log/DSLicSrv.log
A script (Python/PowerShell) can extract:
- Username
- Feature name
- Checkout time
- Check-in time
- Host machine
Generating CSV, Excel, Heatmaps, and Dashboard Visuals provides deep insight.
Sample Utilization Dashboard (Visualization Proposal)
| License Type | Total Seats | Peak Usage | Least Used Hour | Usage Score | Action |
| CATIA MD2 | 10 | 9 (Mon 10AM) | Weekends | ★★★★★ | Retain |
| SIMULIA ABAQUS | 5 | 5 (Wed 2PM) | Early morning | ★★★★☆ | Add 1 or optimize |
| ENOVIA | 8 | 3 | Evenings | ★★☆☆☆ | Reduce or reassign |
(Insert chart visualization: heatmap or trend line)
For Monitoring of license usage
The Monitoring tab provides real-time and historical information about license activity: who is using a license, when they checked it out, denial events, borrow history, and server health.
It typically contains several sub-sections:
Shows events where a user attempted to check out a license but none were available, license server activity and Borrowed licenses for usage tracking
Details of licenses used per timing
Advanced Enhancements
- Automation & Scheduling
- Schedule hourly DSLS CLI exports
- Auto-email reports via scripts
- Integrate with Power BI, Tableau, Excel Power Query
- Governance Best Practices
- Idle session timeout policy
- License borrowing policy
- User education on returning licenses
KPIs to Measure
| KPI | Target Example |
| Peak Usage % | >80% |
| Idle License % | <20% |
| Concurrent Usage Growth | Year-over-year trend |
| License Borrowing Compliance | 100% |
Recommendations
After analyzing usage:
- Reduce under-used licenses
- Reallocate expensive roles to critical users
- Enable “auto return” to prevent hoarding
- Optimize workloads (simulation batch runs during low usage hours)
Final Thoughts
Strategic license management is not only about cost optimization — it is about ensuring productivity, availability, and scalability across engineering teams. With structured tracking, reporting, and optimization, Dassault Systèmes customers can ensure:
- Better utilization
- Data-driven renewals
- Faster workflows
- Improved user experience
When you measure usage — you gain control. When you optimize usage — you gain value.